http://www.chemistrymag.org/cji/2001/038035pe.htm |
Aug. 1,
2001 Vol.3 No.8 P.35 Copyright |
Yu Kaichao#,## , Ye Chaohui #, ##, Wang Xinbing ##,
Lu Guang##, Li Liyun##, Zhuo Renxi ###
(#Department of Chemistry, Huazhong University of Science and Technology,
Wuhan 430074; ## State Key Laboratory of Magnetic Resonance & Atomic and
Molecular Physics, Wuhan Institute of Physics and Mathematics, the Chinese Academy of
Sciences, Wuhan 430071; ### Key Laboratory of Biomedical Polymer Materials of
the Education Ministry of China, College of Chemistry and Environment, Wuhan University,
Wuhan 430072, China)
Recerived Feb.16, 2001; Supported by the Chinese Academy of Sciences, the Ministry of Science & Technology and the Natural Science Foundation Committees of Hubei Province (No. 99J067)
Abstract A new
series of neutral oligomeric manganese (II) complex with oligomeric
phosphate-polyglycol-EDTA ester ligands were synthesized and characterized. The
longitudinal relaxivity of these complexes were measured. One of these complexes with has
high relaxivity, was chosen for the acute toxicity and T1-weighted imaging
test. It has been found that this neutral oligomeric Mn (II) complex exhibits
highly enhanced MRI signal intensity and the increasing duration in the rat liver tissue
compared to Gd-DTPA.
Keywords Magnetic resonance imaging (MRI); Neutral contrast agent; Oligomeric Mn
(II) complex; Relaxivity; Enhancement
Magnetic resonance imaging (MRI) provides a noninvasive and high-resolution diagnostic technique to appreciate exquisite contrast differences between normal and abnormal tissues. With the development of this contrast technique, great efforts have been made to develop safe and effective contrast agents that will improve the precision and diagnostic utility of MRI[1-3]. Research on MRI contrast agents has been mainly focused on the complexes of paramagnetic lanthanide and transition ions (usually GdIII, MnII and FeIII) because they have unpaired f or d electrons which give rise to highly magnetic moment, and thus can reduce the relaxation times of the nearby nuclei via dipolar interactions[1-2]. Some small molecular polyaminopolycarboxylate gadolinium chalets, e.g. Gd-DTPA and Gd-DOTA (DTPA = diethylene-triamine pentaacetic acid; DOTA= 1, 4, 7, 10-tetraaza-cyclododecane -N, N', N", N'"-tetraacetic acid) have been routinely used as clinical contrast agents [1-4].
Gd-DTPA and Gd-DOTA are anionic and nonspecific extracellular contrast agents which undergo elimination completely by glomerular filtration, and are suboptimally effective for detecting hepatobiliary lesions[1-3]. The important aspects of MRI contrast agent design are higher relaxivity, lower toxicity as well as hepatocyte-specificity[1-3]. A comparative study of the dianionic Gd-DTPA and electrically neutral Gd-DTPA-BMA (DTPA-BMA = bis-methylamine-DTPA) has shown that the neutral complex has not only lower osmolarity but also better tolerance in vivo (LD50 properties)[4]. Manganese complex Mn-DPDP (DPDP= dipyridoxal diphosphate ) is uptaken partly by hepatocytes and is excreted by biliary system and by glomerular filtration[5]. Mn-DPDP has been successfully exploited to contrast liver lesions in clinical trail[6,7].
Since the molecular rotation correlation time(t R) is proportional to the molecular size, the attachment of low molecular weight paramagnetic gadolinium chelate to macromolecules can considerably enhance the relaxivity of the chelate unit[1,3]. At the same time, macromolecular contrast agents can prolong the intravascular retention and therefore enhance MR signal in the blood pool[1,3]. However, macromolecular contrast agents tend to have much longer dwell times in the body and less complete elimination, and increase the proportion of cellular uptake, therefore lead potentially to the release of byproducts including free gadolinium[2]. Oligomer contrast agents may meet the satisfaction of both high relaxivity and low toxicity. A new series of neutral oligomeric manganese (II) complexes with terpolymer ligands were synthesized in our lab. The longitudinal relaxation rates of these complexes were measured. One of these complexes was chosen for the acute toxicity measurement and T1-weighted imaging test. 2. EXPERIMENTAL
2.1 Reagents
All solvents were dried and distilled prior to use. Na2[Mn-EDTA]·2H2O and Na2[Gd-DTPA]·2H2O, ethylene diamine tetraacetic dianhydride (EDTAA, m.p.192° C), n-butyl phosphodichloridate (b.p.84°C/1733Pa), ethyl phosphodichloridate (b.p.58°C/1733Pa), methyl phosphodichloridate (b.p.49°C/1733Pa) were prepared according to the literature method. [8-10]
2.2 Synthesis of the materials
For the convenience of discussion, the chemical structures and synthetic scheme of this polymers are shown as below, and taken L1 and Mn-L1 as examples.
|
Ligand:
16.0mmol of 2a (diethylene glycol), 20ml of DMF and 10mg of
N,N-dimethylamino-pyridine (DMAP) were mixed in the flask. Under the protection of dry
nitrogen, 12.0mmol of EDTAA was added, the mixture was slowly warmed to 78°C and stirred
for 24h. Then 20ml DMF was added. After cooling to ca 30° C, 8.0mmol N-methyl-morpholine
(NMM) and 4.0mmol 1a (n-butyl phosphodichloridate) were added dropwise
respectively. The reaction mixture was slowly warmed to 75°C and stirred for another 24h.
After cooling to ca 50°C, the mixture liquid was dropped into the mixed solvents of
ethanol and ether (2:1 v/v). The solid was dissolved in DMF again, and precipitated in
ethanol and ether. This purification procedure should be repeated 3-4 times, and white
solid (L1) was obtained.
Complex: 2.0 mmol of L1 was dissolved in 5 mL
DMF, 2.0 mmol of manganese (II) chloride in 5 mmol DMF was added, and the mixture was
stirred at 35°C for 1h. The solution was added dropwise to the mixed solvent of ethanol
and ether (2:1 v/v). The precipitated polymer complex was purified by means of washing
with ethanol and ether, successively. After dried in vacuum, light pink powder product was
obtained. The structural parameters of this and other oligomeric complexes are listed in
Table 1.
Tab.1 The structural parameters of MnII complexes
| Complex | D | R | m:n(constitution) | q* | |
| Mn-L1 | 1 | C4H9-n | 0.75:0.25 | 2830 | 2 |
| Mn-L2 | 1 | C2H5 | 0.79:0.21 | 2660 | 2 |
| Mn-L3 | 1 | CH3 | 0.68:0.32 | 2710 | 3 |
| Mn-L4 | 2 | C4H9-n | 0.79:0.21 | 2650 | 2 |
| Mn-L5 | 2 | C2H5 | 0.66:0.34 | 2460 | 3 |
| Mn-L6 | 2 | CH3 | o.75:0.25 | 2310 | 3 |
*Average water molecules in each [Mn-EDTA-PG] unit.
2.3 Analysis
The IR spectra were recorded on a Nicolet 170 SX IR spectrometer (KBr tablet). 1H-NMR
spectra were measured on a Bruker ARX 500 spectrometer. Number - average molecular weights
(![]() )
were surveyed on Knauer VPO spectrometer. The elemental analyses were performed on a Carlo
Erba 1106 analyzer. DSC was tested on the PCT-1 thermal-weight balance (Beijing
Spectrometer Factory). The metal content in each complex was determined by EDTA
complexometric titration method after the complex nitrated with mixed acids of HNO3(65%)
and HCl(36%)[11-13].
)
were surveyed on Knauer VPO spectrometer. The elemental analyses were performed on a Carlo
Erba 1106 analyzer. DSC was tested on the PCT-1 thermal-weight balance (Beijing
Spectrometer Factory). The metal content in each complex was determined by EDTA
complexometric titration method after the complex nitrated with mixed acids of HNO3(65%)
and HCl(36%)[11-13].
2.4 Relaxation measurement
The proton longitudinal relaxation time (T1) for paramagnetic metal complexes
in distilled water was measured on Bruker AC 80 NMR spectrometer by an inverse recovery
method at 21±1°C. The relaxivity (R1) of each complex is calculated according
to Eq.(2)[1].
(1/T1)obsd = (1/T1)d + R1[M]
(2)
where (1/T1)obsd and (1/T1)d are proton
relaxation rates in the presence of and in the absence of paramagnetic species,
respectively; [M] is the concentration of paramagnetic species.
2.5 Acute Toxicity
One of these oligomeric Mn(II) complexes, Mn-L1 ,which has high
relaxivity, was chosen for the acute toxicity test. The acute toxicity was tested
by single intravenous (trail vein) injection of a 0.2mol/L solution at a rate of 2mL/min
in mice (20±2g, male and female). The animals were continuously observed for 7-14 days
after the injection.
The acute toxicity test using Mn-L1 showed no obvious
toxicity.
2.6 MR Imaging
The compared MR imaging between Mn-L1 and Gd-DTPA was
performed on a 4.7T imager (Bruker Biospec 47/30). Wistar rats weighing 180±25g (3 rats
each group) were anaesthetized with 2% pentobarbital sodium solution ip, axial images of
2mm slice thickness were acquired by spin-echo technique using TE (Time of echo) = 13ms,
TR (Time of repeat) = 500ms, NA(number of averages) = 2. After the rat received injection
of Mn-L1 or Gd-DTPA (dose ~ 0.1mM) intravenously, the imaging
on the same slice was continued every 5 minutes for over one hour.
3.1 Structure characterization
The dH of NMR (in CDCl3) of ligands: 4.0-4.4(-OCH2-), 3.4-3.7(=NCH2CO-), 2.5-2.9(-NCH2CH2N-) are from L1-L6; 0.9, 1.2-1.8(-CH2CH2CH3) from L1 and L4; 1.2(-CH3) for L2 and L5, 3.8 (-OCH3) from L3 and L6. The data of elemental analysis (EA) are as following:
L1 Found: C, 44.57; H, 6.73; N, 6.38. Thus lead to the ratio of P : EE = 0.75:0.25 or 1:0.33, that means in the terpolymer chain, each EDTA ester recurring unit (EE) accompanied with 0.33 phosphate unite (P) in average, and one absorbing water molecule (Calcd: C, 43.99; H, 6.57; N, 6.16), which is confirmed by DSC that the lost weight be 4% when the temperature reach the range of 95-110°C.
L2 Found: C, 42.85; H, 6.29; N, 6.62, lead to the ratio of P:EE = 0.79:0.21 or 1:0.26, and one absorbing water molecule in each EDTA ester recurring unit (Calcd: C, 43.33; H, 6.40; N, 6.49).
L3 Found: C, 41.69; H, 6.71; N, 6.29, lead to the ratio of P:EE = 0.68:0.32 or 1:0.48, with one and half absorbing water molecules in each EDTA ester recurring unit (Calcd: C, 41.31; H, 6.40; N, 5.87).
L4 Found: C, 44.76; H, 6.56; N, 6.02, lead to the ratio of P:EE = 0.79:0.21 or 1:0.27, with one absorbing water molecule in each EDTA ester recurring unit (Calcd: C, 45.21; H, 6.83; N, 5.64).
L5 Found: C, 42.61; H, 6.67; N, 5.30, the ratio of P:EE = 0.66:0.34 or 1:0.52, with two absorbing water molecules in each EDTA ester recurring unit (Calcd: C, 42.68; H, 6.90; N, 4.94;).
L6 Found: C, 42.58; H, 6.92; N, 5.78), lead to the ratio of P:EE = 0.75:0.25 or 1:0.48, with one and half absorbing water molecules in each EDTA ester recurring unit (Calcd: C, 43.26; H, 6.73; N, 5.49).
IR spectra of L1-L6 exhibit the characteristic absorption peaks or the ester bond nc=o: 1745-1735 cm-1 and nc-o-c: 1230-1220 cm-1; the phosphoryl bond n P=o: 1275-1296 cm-1 and phosphonate ester bond nP-o-c: 1040; 770cm-1. All of the oligomeric manganese (II) complexes are soluble in water. The results of VPO measurement indicate that the Number-average molecular weights (
Tab. 2 The data of elementary analysis and relaxation measurement of complexes
Complex |
Elem. Anal. |
Calcd. |
(Found) |
(%) |
R1/MnII(mM× s)-1 |
C |
H |
N |
Mn |
||
Mn-L1 |
39.02 (38.05) |
6.33 (5.68) |
5.26 (5.33) |
9.90 (10.45) |
3.37 |
Mn-L2 |
36.74 (37.21) |
5.97 (5.49) |
5.64 |
11.36 (10.97) |
3.10 |
Mn-L3 |
34.88 (35.37) |
6.10 (5.66) |
5.53 (5.02) |
10.45 (9.84) |
3.19 |
Mn-L4 |
40.05 (39.52) |
6.56 (5.96) |
5.36 (4.97) |
9.63 (9.74) |
2.94 |
Mn-L5 |
38.29 (37.94) |
6.41 (6.13) |
4.97 (4.39) |
9.20 (8.61) |
2.78 |
Mn-L6 |
37.02 (37.40) |
5.76 (5.99) |
4.99 (4.75) |
9.58 (9.31) |
3.06 |
[Mn× EDTA]2- |
1.84 |
||||
[Gd-DTPA]2- |
4.95 |
*T1(d)=2.71s, Temperature: 21°C, Frequency: 80.13M Hz.
3.2 Relaxivity
The results of the longitudinal relaxation times (T1) and the calculated
relaxivities (R1) of the complexes are given in Table II. The data indicate
that all of these oligomeric Mn(II) complexes showed higher relaxivity which are over 50%
more than that of the relative small molecular complex Mn-EDTA, but lower than that of
Gd-DTPA. Naturally, the increased portion in R1 is due to the increased
molecular size of oligomeric Mn(II) complexes relative to Mn-EDTA.
3.3 MR Imaging
In the T1-weighted imaging experiments on alive animal, the water proton signal
intensities of the liver (parenchyma) are increased after the intravenous injection of Mn-L1
and Gd-DTPA, respectively (dose: 0.1 mmol/kg). The images before and after injection of
Mn-L1 are shown in Figure 1. The time course intensity changes are
plotted in Figure 2. Here the data is the average from three rats and the error is within
±5%, and the first data point (0 min) is taken from the image before injection of the
contrast agents and is used as reference (100%) to set the scale of the signals (Fig.1-1
is one of them) .
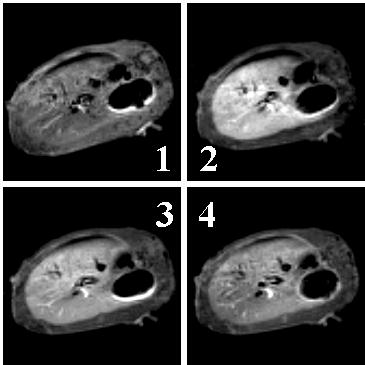
Fig. 1 Comparison of T1-weighted
imaging portraits for the same axial slice of a Wistar rat (180g)
(1) Without contrast agent; (2), (3), (4) 10 min, 35 min and 65 min after injection of Mn-L1
as contrast agent (dose: 0.1mmol/kg)
Fig. 2 The time course MRI signal intensity enhancement after the injection of Mn-L1 and Gd-DTPA
As shown in these figs, after the injection of Mn-L1, the highest enhancement (150-170%) is observed in about 10 min (Fig.1-2), then decreased along with the time past. Between 20-45 minutes, steady and ideal contrast enhanced effects are obtained (Fig.1-3). At 65min, relative enhancement is still maintained at 110% (Fig.1-4). The total relative enhancement of signal was 125%. In the case of Gd-DTPA, the enhancements increased slowly in the period of first 25 min after the injection, the highest enhancement was 125-140% about 25 min; then maintained this level for 20 minute, at last decreased. at 65min, enhancement was almost disappeared (103%). It's total relative enhancement of signal was 114%. These results showed that, compared with Gd-DTPA, Mn-L1 produces relaxation enhancement in liver tissue more strong and last longer. This could be explained by the binding of MnII complexes to serum albumin and membrane surfaces in vivo, which generating great relaxivity[14,15].
REFERENCES[1] Lauffer R B. Chem.Rev., 1987, 87: 901.
[2] Caravan P, Ellison J J, McMurry T J et al. Chem. Rev., 1999, 99 (9): 2293.
[3] Unger E C, Shen D K, Wu G L et al. Magn. Reson. Materils in phys., Biol&Med., 1999, 8: 154.
[4] Cacheris W P, Quay S C, Rocklage S M. Magn Reson Imag, 1990, 8: 467.
[5] Elizonde G E, Fretz C J, Stark D D et al. Radiology, 1991, 178: 73.
[6] Hamm B, Vogl T J, Branding G et al. Radiology, 1992, 182: 167.
[7] Aicher K P, Laniado M, Kopp A F et al. J Magn Reson Imag, 1993, 3: 731.
[8] Shi F, Ni J Z. Chemical Reagents (Huaxue Shiji), 1991,13 (4): 225.
[9] Qin S Y. Chin. J. of Org. Chem. (Youji Huaxue), 1984, (4): 290.
[10] Gruuze H. Angew. Chem., 1959, 71:70.
[11] Lin S C, Chi X W, Guo J X et al. Quantitative analysis chemistry (Dingliang Fenxi Huaxue), Beijing: Beijing Normal University Press, 1991: 505.
[12] Shi W Z, Lu X H. Analytic Methods of Trace Elements in Bio-materials (Shengwu Cailiao Zhong De Henliang Yuansu Fenxi Fangfa ). Wuhan: Huazhong University of Science and Technology Press, 1994: 271.
[13] Lab. of Anal Chem, Depart.of Chem, Hangzhou University. Handbooks of Analytic Chemistry (Fenxi Huaxue Shouce), Book II, Chemical Analysis ( Huaxue Fenxi), Beijing: Chemical Industrial Press, 1982: 620.
[14] Kang Y S, Gore J C, Armitage I M. Magn. Reson. Med., 1984, 1: 396.
[15] Koenig S H, Brown R D, Goldstein E J et al., Magn. Reson. Med., 1985, 2: 159.