http://www.chemistrymag.org/cji/2002/043012pe.htm |
Feb. 1,
2002 Vol.4 No.3 P.12 Copyright |
---- Cyclic voltammogram response of Ce4+/Ce3+redox couple in H2SO4 solution
Xia Xi, Liu Hongtao,
Liu Yang
(Institute of Applied Chemistry, Xinjiang University, Urumqi, 830046, China)
Received Nov.8, 2001; Supported by the National Natural Science Foundation of China (29963002).
Abstract By the replacement of V5+/V4+
couple in an all-vanadium redox flow cell with Ce4+/Ce3+, a
completely novel Ce4+/Ce3+-V2+/V3+ redox cell
have been designed. The electrochemical responses of higher concentration Ce4+/Ce3+
couple in H2SO4 solution at inert electrodes such as platinum (Pt),
glassy carbon (GC) and graphite (Gr) were investigated mainly by using cyclic
voltammogram. The well-defined voltammograms at all the inert electrodes indicated
quasi-reversible behaviors for the Ce4+/Ce3+ couple in H2SO4
solution. The kinetic parameters for the anodic oxidation of Ce3+ and cathodic
reduction of Ce4+ were measured by the relationship between the overpotential
and the logarithm of current. The normal potential of the Ce4+/Ce3+
couple was derived from the cyclic voltammograms. Based on the findings, it showed that
the surface of platinum electrode was fully covered with type oxide which inhibited the
reduction of Ce4+, and the reversibility of Ce4+/Ce3+
couple improved with the increase of H2SO4 concentration. Besides,
the electrochemical active substances maybe existed in different forms at varied state of
charge (SOC), and the reversibility of Ce4+/Ce3+ couple at carbon
electrode was superior to the platinum electrode.
Keywords Redox flow cell; cyclic voltammogram; Ce4+/Ce3+ couple;
state of charge
1. INTRODUCTION
The Ce4+/Ce3+ couple was chosen as the positive electrolyte of
Cerium (Ce4+/Ce3+) -Vanadium (V2+/V3+) redox
flow cell mainly for the reasons as follows: 1) The high potential of Ce4+/Ce3+
couple. If it was matched with possible negative electrolyte, such as V2+/V3+,
the theoretical open circuit voltage would be 1.96,1.87,1.7,1.54 V (vs. SHE) in HClO4,
HNO3, H2SO4, HCl solutions respectively, thoroughly
satisfying the requirements to the practical batteries. And its open circuit voltage is
higher than the conventional redox flow cells, such as Fe-Cr[1] (1.18 V vs.
SHE), Fe-Ti [2](0.67 V vs. SHE) and all vanadium [3](1.26 V vs. SHE)
redox flow cell. Just because of its high potential, Ce4+ was often used to the
oxidation titration of Fe2+[4], I-[5], the oxidation of the organic
molecular in waste water, the oxidation of Cl- to Cl2 in chloralkali
industry[7] and the oxidation of H2O to O2 as well[8].
2) Both the reduction of Ce4+ at Pt, Au, Ir[9], highly boron-doped
conductive diamond electrodes[10] and the oxidation of Ce3+ at Pt,
Au, GC[11], PbO2[12,13], SnO2[6] electrodes
were investigated, and Klekens[14] reported that the reduction of Ce4+
was not concerned with the electrode materials, the charge transfer coefficient (a ) and the heterogeneous rate constant
(kc) were similar at different electrodes, for instance, at Pt, Au, GC
electrodes the kc was 3.7×10⁻⁴[15], 4.8 × 10⁻⁴[16], 3.8
× 10-4[15]cm s-1, and a was 0.21[15], 0.35[16], 0.28[15]
respectively. But as to the oxidation of Ce3+, the various electrodes had
different effects on the reaction of Ce3+![]() Ce4+ +e-.
Ce4+ +e-.
Here H2SO4 was chosen as the acid
media mainly due to that: 1) in HClO4 or HNO3 solution, the
potential of Ce4+/Ce3+ couple is high, far above the over-potential
of oxygen evolution, and the Ce4+/Ce3+ couple is not stable in HClO4
or HNO3 solution[17,18]. Although the potential of Ce4+/Ce3+
couple is also high enough in H2SO4 solution, Kunz [19]
proved that Ce(SO4)2 could stably exist in H2SO4
solution, it seldom took place the redox reaction anyway, the stability of electrochemical
active material was especially important in redox flow cell. 2) ClO4-
and NO3- can not form stable complexes with Ce4+ and Ce3+
(this is also the reason that the potential of this couple is higher than that in H2SO4
solution), however, SO42- can form complex with Ce4+,
existed in the form of CeSO42+, Ce(SO4)2 and
Ce(SO4)32-[10]. Because of the formation of
stable complex, it was generally accepted that the Ce4+ and Ce3+
would not undergo hydrolysis in H2SO4 solution. 3) If trying to take
HCl as the acid media, then Ce4+ would oxidate Cl- to Cl2:
2Cl-+2Ce4+![]() Cl2+2Ce3+ (1)
Cl2+2Ce3+ (1)
Andrew Mills[7] ever used the Ru, Ir oxide as the catalyst to accelerate this
reaction, which demonstrated that the Ce4+/Ce3+ couple was unstable
in HCl solution.
In the previous works, it was chiefly focused on electroanalysis, and
the concentration of Ce4+/Ce3+ couple ever used was quite low,
varied from several to dozens of mmol, but as the electroactive materials used in redox
flow cell, the solubility of reactant and product should be large enough, therefore in
this paper the concentration of Ce4+ and Ce3+ were both above 0.1
mol dm-3. Through the cyclic voltammogram response of Ce4+/Ce3+
couple at inert working electrode, we investigated the reversibility of the couple in H2SO4
solution.
2. EXPERIMENTAL
2.1. Apparatus and experiment steps
The curves of current versus potential were recorded in a 3-compartment cell, with Pt
(0.2 cm2), GC (0.16 cm2), and Gr (1.13 cm2) as inert
working electrodes respectively, the auxiliary electrode was a platinum sheet. All
potentials were expressed relative to the Hg/Hg2SO4 electrode, which
was connected with the electrochemical cell through a salt bridge full of H2SO4
electrolytic solution.
The electrolytic solutions used were 0.5, 1.25, and 2 mol dm-3 H2SO4,
the cerium salts (analytical grade), including Ce(SO4)2 ·4H2O
and Ce2(SO4)3, were used as received. The cyclic
voltammogram was measured by the CHI660 electrochemical station (CH Corporation, USA).
To get reproducible experimental data, the Pt electrode was pretreated
as the following procedures, a 10 minutes' ultrasonification
(JY92-2D ultrasonic cell pulverizer) was followed by a potential cycling for 20 minutes at
50 mV·s-1 between 1.80 and -0.6 V, then a potential programme (scheme 1[15])
was used to record polarization curves for producing a layer of constant platinum oxide
thickness.
By the above pretreatment the type platinum oxide would reach an
apparently limiting covered thickness. The glassy carbon electrode was cycled between 1.3
and -1.0 V (vs. SCE) for 10 minutes at a scan rate of 0.03 V·s-1 after which
it was held successively at 0.5 and 0 V (vs. SCE) for 5 minutes. According to the above
treatment, reproducible GC electrode surface could be obtained[14]. Solutions
were de-aerated 15 minutes by bubbling with nitrogen before each measurement.
2.2. The mathematical treatment of
results
The peak current and the peak potential have the relationship as follows[10]:
Ep= constant - (RT/2anF)lnn T=298K (2)
Ip=299(an)1/2ACj*Dj1/2n1/2
(3)
where Ep is the peak potential, a is the transfer coefficient, n is the number of electrons involved
in the rate-determining step, n is the potential scan rate, Ip is the peak current, A
is the surface area of the working electrode, cj* is the bulk
concentration of species j and Dj is the diffusion coefficient of species j.
From equation (2), the values of a, b
(the cathodic and anodic transfer coefficient) can be obtained by the plot of Ep
versus lnn . Using the
value of a, b obtained, a proportional relation
between Ip and n1/2
can be observed, and Dj can also be easily obtained.
The peak current may be expressed as [20]
Ip=0.227nFACj*k0exp[-(anF/RT)( Ep-E0')]
(4)
A plot of ln(ip) versus (Ep-E0'),
determined by different scan rates, should thus have a slope proportional to a and an intercept proportional to k0.
The formal potential of the electrode (E0')
was estimated from the results of cyclic voltammogram[21]
E0'=S(Epa+EPc)/2m
(5)
where Epa and Epc are the anodic and cathodic peak potential, m is
the total numbers of scanning.
3. RESULTS AND DISCUSSION
3.1. The effect of preoxidation at the surface of Pt electrode on the Ce4+/Ce3+
couple
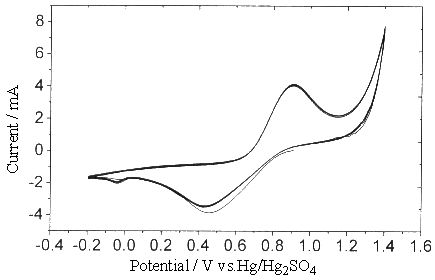
Fig.1 Plot of cyclic voltammogram in 0.3 mol dm-3 Ce(SO4)2
+ 2mol dm-3 H2SO4 solution, sweep rate is 0.05V s-1
at Pt electrode.
Due to the high potential of Ce4+/Ce3+
couple, the metal electrode even including the noble metal, such as Pt, Au et al. could
not avoid being oxidated. From Fig.1. it is easy to observe that the cathodic and the
anodic current peaks are located between 0.4 - 0.9 V. Another small reduction peak current
between 0 and -0.2 V is the result of the platinum oxide reduced.
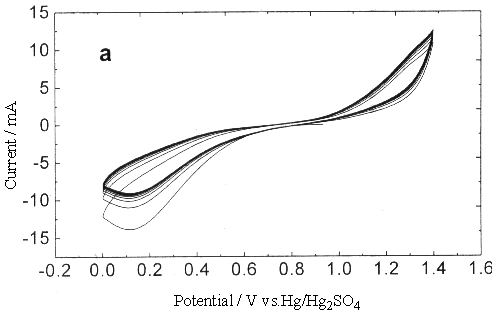
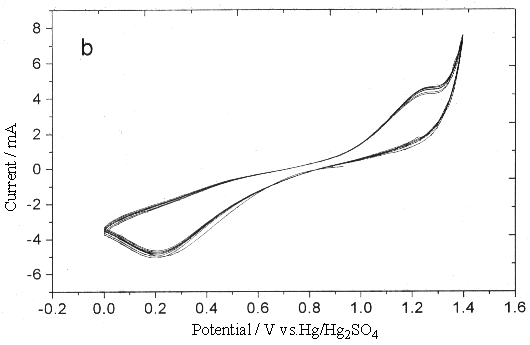
Fig.2 Plot of cyclic voltammogram in 0.3 mol dm-3 Ce(SO4)2
+ 1.25mol dm-3 H2SO4 solution, sweep rate (a) 0.25, (b)
0.05V s-1 (between 0~1.4V).
To investigate the effect of this oxide on
the Ce4+/Ce3+ couple, the sweep width ranged from 0-1.4 V to
-0.2-1.4 V. Fig.2 showed clearly that the existence of platinum oxide inhibited the
oxidation of Ce3+, especially while the sweep rate was fast, the distinct
anodic peak could not be observed, which was attributed to the oxygen-evolution reaction.
Compared with Fig.2, the cyclic voltammogram Fig.3 scanning from 0.2 to 1.4 V, the surface
oxide of platinum metal could be partly got rid of (under so high potential conditions,
there was no way to completely reduce the platinum oxide, even if it could be achieved,
while scanning toward the anodic direction, the platinum oxide could be produced again).
Due to the similarity of the oxygen-evolution current and potential to the two different
scan widths, this difference can not attribute to the oxygen-evolution reaction which make
the anodic current peak of Ce3+ disappear.
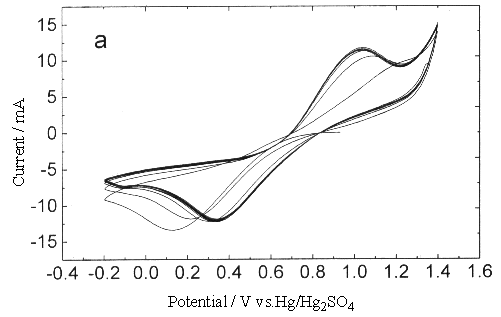
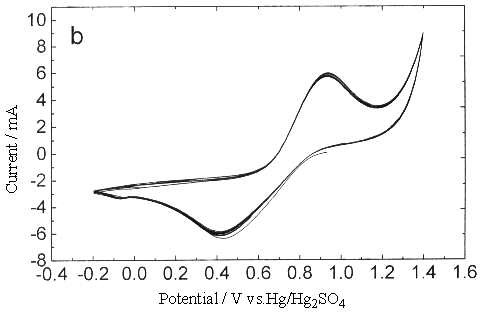
Fig.3 Plot of cyclic voltammogram in 0.3 mol dm-3 Ce(SO4)2
+ 1.25mol dm-3 H2SO4 solution, sweep rate (a) 0.25, (b)
0.05V s-1 (between 0.2-1.4V).
Therefore this can only
attribute to the inhibit of platinum oxide to the oxidation of Ce3+, make the
anodic reaction move toward more positive voltage until it enters the span of
oxygen-evolution reaction. Although while the sweep rate was low, the anodic peak current
of Ce3+ could be obvious to observe, its peak potential was higher than in the
sweep width -0.2 - 1.4 V under the same sweep rate condition, the peak current decreased
slightly. One possible reason was that the conductivity of platinum oxide formed at eh
surface of platinm was poorer, which would add the resistance of the transfer of
electrons. Another reason maybe was that the platinum oxide occupied some active position
on the surface of platinum, this would reduce the effective reaction sites at the same
time when increasing the apparent surface area. Of course it was also a possibility that
the existence of platinum oxide changed the interfacial double layer structure between the
solution and metal, caused the change of inner potential, which changed the electric field
across the interface, and directly affected the transferring rate of electron.
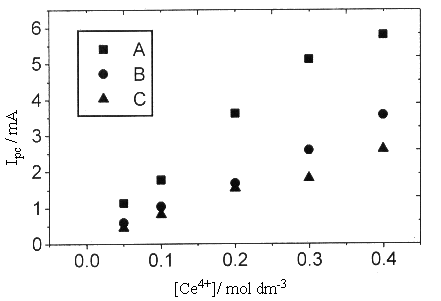
Fig.4 Plots of cathodic peak current versus Ce4+ concentration
obtained for a Pt electrode in 1.25mol dm-3 H2SO4
solution with different scan rates (A)0.05, (B)0.01, (C)0.005 V s-1, at 25oC.
A.T.Kuhn has reported[22]
that the type platinum oxide existed in the form of PtO2, and was good
electronic conductor, its conductivity was the same as platinum metal, but specific
conductance of chemically prepared PtO2 powder was 10-6 W -1·cm-1 and
behaved as semiconductors. However the electrific conductance of type platinum oxide was
much less[(1-2)×10-3 W -1·cm-1]. As a result, type platinum oxide
does not inhibit the charge-transfer process but the type platinum oxide do so. In this
paper by the pretreatment it only produces type platinum oxide, without type platinum
oxide (type platinum oxide can only be produced by oxidating more than 15 minutes under
the voltage of 1.7 V). Therefore the inhibit of platinum oxide to the oxidation of Ce3+
was not due to the existence of type platinum oxide. It was possible that the Ce3+ absorbed
on the surface of platinum through the oxygen bridge and occupied the active position of
surface, inhibited the transfer of Ce3+ from the bulk solution, as a result it
made the anodic overpotential increase.
To the reduction of Ce4+, while the surface of platinum was
covered with type platinum oxide, it was obvious to see from Fig.2 that the peak current
almost kept the constant but the peak potential moved toward the cathodic direction, which
demonstrated that at the stationary electrode, although the charge-transfer was inhibited
somehow (peak potential moved toward the cathodic direction), it could still reach the
diffusion-controlling limiting current. It was generally accepted that Ce4+
would not absorb on the surface of electrode, so the increase of cathodic overpotential
was possible because of the inhibit of platinum oxide to the charge transfer.
3.2 Effect of initial Ce4+
concentration on the Ce4+/Ce3+ couple
Fig.4 showed the relation of cathodic peak current with the concentration of Ce4+
in 1.25 mol dm-3 H2SO4 solution. While the sweep rate
<0.05 V s-1, a proportional relationship could be obtained, which proved
that the reduction current was only dependent on the reduction reaction of Ce4++e-![]() Ce3+,
without any other disturbance. On the other hand, the oxygen-evolution current was almost
invariable when the concentration of Ce4+ changed, which proved that the
existence of Ce4+ had no effect on the evolution of oxygen.
Ce3+,
without any other disturbance. On the other hand, the oxygen-evolution current was almost
invariable when the concentration of Ce4+ changed, which proved that the
existence of Ce4+ had no effect on the evolution of oxygen.
3.3 The effect of different state of
charge (SOC) on the Ce4+/Ce3+ couple
Reducing the 0.4 mol dm-3 Ce(SO4)2 in 1.25 mol dm-3
H2SO4 solution to 75% and 50% SOC respectively, the results were
given in Table 1. From the cathodic reaction rate constant (kc), it was easy to
observe that while the total concentration of cerium ions kept the constant, the value of
kc firstly decreased from 100% to 75% SOC, then it would increase from 75% to
50% SOC, which showed that the polarizing resistance of 75% SOC electrolyte was much
larger, while that of 50% SOC and 100% SOC was relatively much smaller. According to
conventional hypothesis, with the increase of Ce3+ concentration and the
decrease in the concentration of Ce4+, the normal potential E0' should decrease, but here it was controversial. The value of E0' under 75% SOC increased to 0.76 V, almost the same as that of
0.3 mol dm-3 Ce(SO4)2 in 0.5 mol dm-3 H2SO4
solution, and the value of a=0.153 was similar to that in the solution mentioned above (a=0.157).
| SOC % |
E0 (V) |
a | b | kc×10
4 (cm·s-1) |
ka × 10 4 (cm·s-1) |
| 100 | 0.68 | 0.132 | 4.1 | ||
| 75 | 0.76 | 0.153 | 0.23 | 2.18 | 3.13 |
| 50 | 0.739 | 0.155 | 0.197 | 2.99 | 2.93 |
From subsection 3.4, it seemed that the electroactive substances maybe existed in different forms in 0.5 and 1.25 mol dm-3 H2SO4 solutions. The kinetic parameters of 75% SOC (0.4 mol dm-3 Ce(SO4)2 in 1.25 mol dm-3 H2SO4 solution) were similar to those in 0.5 mol dm-3 H2SO4 solution with the same concentration of Ce4+, therefore it was reasonable to believe that the electroactive substances of 75% SOC in 1.25 mol dm-3 H2SO4 solution were different from those in 100% SOC but just the same as the electroactive substances in 0.5 mol dm-3 H2SO4 solution. As a result it was reasonable to think that the electroactive substances changed from 100% to 75% SOC were not simply due to the difference of Ce4+ concentration. Because when the concentration of Ce4+ decreased from 0.4 to 0.3, 0.2 mol dm-3 in 1.25 mol dm-3 H2SO4 solution, it could be seen clearly from Table 1 that E0' was 0.68, 0.682, 0.634 V respectively, almost invariable, besides it, the kc was similar, too, was 4.1×10⁻⁴, 4.03×10⁻⁴ and 3.6×10⁻⁴cm s-1 respectively. these results all proved that the property of the reactant to the reduction of Ce4+ in different concentration of H2SO4 solution was the same. Therefore, the variation of E0' and kc in different SOC can only attribute to the variation of Ce3+. When the Ce3+ absorbed on the surface of oxide, it would make the oxidation of Ce3+ more difficult, even lead to the anodic peak potential shifting positively more than 0.1 V when changed from 100% to 75% SOC with the same sweep rate.
3.4 The effect of different H2SO4
solution concentration on the Ce4+/Ce3+ couple
Because the Ce4+ will undergo hydrolysis when the concentration of H2SO4
solutions is below 0.5 mol dm-3, so the concentration of H2SO4
solution used here was above 0.5 mol dm-3. Additionally, the purpose of this
paper was to investigate the Ce4+/Ce3+ couple used in redox flow
cell, and to improve the specific energy of electroactive substances in a unit volume, the
concentration of Ce(SO4)2 should be as large as possible. But it was
still an accepted fact that the solubility of Ce(SO4)2 decreases
with the increase of H2SO4 concentration. Therefore the maximum
concentration of H2SO4 used here should be 2 mol dm-3.
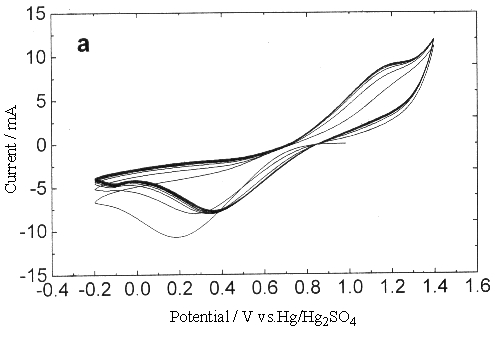

Fig.5 Plot of cyclic voltammogram in 0.3 mol dm-3 Ce(SO4)2
+ 0.5mol dm-3 H2SO4 solution, sweep rate (a) 0.25, (b)
0.05V s-1 .
Fig 1, 3, 5 showed the
cyclic voltammogram behavior of Ce(SO4)2 in 2, 1.25 and 0.5mol dm-3
H2SO4 solution. From the values of normal potential E0' listed in Table 2, the distinct differences in 0.5 , 1.25 and
2 mol dm-3 H2SO4 solutions were easily to see. This
demonstrated that in 1.25 and 2 mol dm-3 H2SO4 solutions
Ce4+ existed in the same form of complex, but they were different from the
complex ions in 0.5 mol dm-3 H2SO4 solution, and the
complex in the former solution was more stable than that in the latter solution, the free
Ce4+ was also less in the former solution so as to its normal potential was
higher than that in the latter one. In H2SO4 solution, the Ce4+
could form the following complexes with SO42-
Ce4+ + HSO4- = CeSO42+ + H+
(6)
CeSO42+ + HSO4- = Ce(SO4)2 +
H+
(7)
Ce(SO4)2 + HSO4- = Ce(SO4)32-
(8)
where the equilibrium constants are 3500, 200 and 20[16] for reactions (6) -
(8) respectively. While the concentration of H2SO4 was 0.5 mol dm-3,
[Ce4+]/[Ce3+]=3/11, the parts of Ce(SO4)32-
of the complexes were less, accordingly the free Ce4+ would be more. But in
1.25 and 2 mol dm-3 H2SO4 solutions the ratio of [Ce4+]/[Ce3+]<1/6,
the three kinds of complexes could all exist in solution but the free Ce4+ may
be correspondingly less.
| H2SO4
(mol dm-3) |
sweep rate (V·s-1) |
||||
| 0.25 | 0.1 | 0.05 | 0.01 | 0.005 | |
| 2 | 0.664 | 0.54 | 0.462 | 0.32 | 0.262 |
| 1.25 | 0.706 | 0.594 | 0.522 | 0.374 | 0.316 |
| 0.5 | 0.849 | 0.697 | 0.622 | 0.382 | 0.34 |
From Table 2, it was clear that the
reversibility of Ce4+/Ce3+ couple improved with the increase of H2SO4
concentration. As the DEp decreased with the increase of H2SO4
concentration, Above two points showed that the Ce4+/Ce3+ couple was
not simply an one-electron transfer reaction
Ce4+ + e- ![]() Ce3+
(9)
Ce3+
(9)
but the reactant and product were concerned with SO42- and H+,
Randle[9] reported that the possible reactions may be:
Ce(SO4)q +pSO42-![]() Ce(SO4)q+P+e-
(10)
Ce(SO4)q+P+e-
(10)
or the kinetically indistinguishable mechanism
Ce(SO4)q+pSO42-![]() Ce(SO4)q+P (fast)
(11)
Ce(SO4)q+P (fast)
(11)
Ce(SO4)q+p![]() Ce(SO4)q+P+e-
(slow)
(12)
Ce(SO4)q+P+e-
(slow)
(12)
The participating sulphate species may be HSO4- and not SO42-.
3.5 The effect of different inert
working electrodes on the Ce4+/Ce3+ couple
Fig.3, 6, 7 were the cyclic voltammogram results of Ce4+/Ce3+ couple
at Pt, GC and Gr electrodes. Judged by the difference of anodic and cathodic peak
potential, the reversibility of Ce4+/Ce3+ couple at Gr electrode was
the best, then the GC electrode, and the Pt electrode was the poorest one. It was clear
that, at the surfaces of GC and Gr electrodes, while the sweep rate <0.05 V·s-1,
little varied Epc, when the sweep rate < 0.005 V·s-1, the values
of Epa varied little, too. This proved that there was no absorption on the
surface of GC, Gr electrodes, and the non-Faraday charge was slight. The overcharge was
caused mostly by the heterogeneous charge transfer. Because of the similarity of DEp between cathodic and
anodic peak potential under different sweep rate, therefore the values of a and kc could not be
obtained by the equation (3).
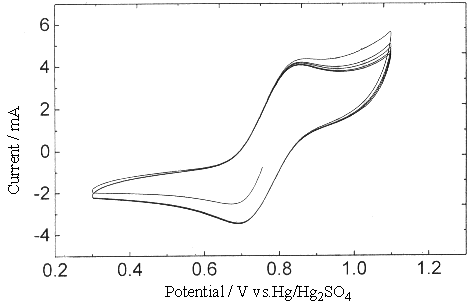
Fig.6 Plot of cyclic voltammogram at Gr electrode in 1.25 mol dm-3 H2SO4
solution, [Ce4+]=0.3, [Ce3+]=0.1 mol dm-3. (sweep rate
0.005V s-1 ).
Within the scanning width of cyclic voltam,
mogram (<1.3 V), it was impossible to produce oxide on the surface of GC and Gr
electrodes, so there was no inhibition to the oxidation of Ce3+. But in the
rotating ring disk electrode experiment (to be published), while the potential was above
1.5 V, there did produce a layer of oxidation film at the surface of GC electrode.
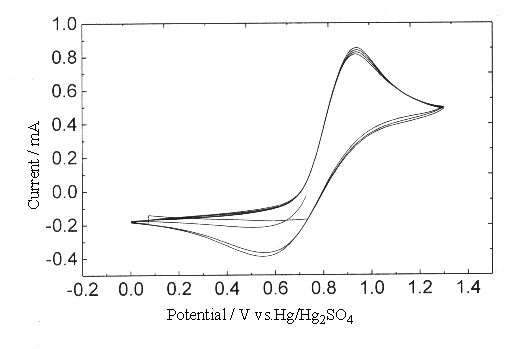
Fig.7 Plot of cyclic voltammogram at Gr electrode in 0.5 mol dm-3 H2SO4
solution, [Ce4+]=0.2, [Ce3+]=0.1 mol dm-3. (sweep rate
0.005V s-1 ).
4. CONCLUSIONS
According to the above statements, some conclusions can be surely drawn as follows. The
type I platinum oxide with a specific conductance of 10-6W-1cm-1
fully covered at the surface of the electrode just inhibited the redox reaction to some
extent. And the forms of electroactive substances existed in the solution varied a bit
with the different SOC of Ce4+/Ce3+ system. In addition, the H2SO4
concentration had an apparent effect on the reversibility of Ce4+/Ce3+
system, which could be clearly seen here with the increase of H2SO4
concentration from 0.5 mol·dm-3 to 2 mol·dm-3, the reversibility
of the system has visibly improved. Finally, because of no adsorption of Ce4+
or Ce3+ and formation of oxides at the surface of GC and Gr electrodes, these
Carbon electrodes were more suitable for Ce4+/Ce3+ system than the
platinum electrode. In short, the cyclic voltammogram results have demonstrated the
feasibility of replacing V5+/V4+ with very high concentration of Ce4+/Ce3+
and forming a completely novel redox cell.
REFERENCES
[1] Fedkiw P S, Watts R W. J.Electrochem.Soc., 1984, 131: 701.
[2] Liu C C, Galasco R T, Savinell R F. J.Electrochem.Soc., 1982, 129: 2502.
[3] Gu J, Li G Q, Xu Q, Chinese J.Power Sources, 2000, 24: 116.
[4] Fenton Jr A J, Furman N H. Anal.Chem., 1957, 29: 221.
[5] Lingane J J, Langford C H, Anson F C. Analyticachimica Acta, 1957, 16: 165.
[6] Kotz R, Stucki S, Carcer B. J.Applied Electrochemi., 1991, 21: 14.
[7] Mills A, Worsley D. J.Chem.Soc.Faraday trans., 1991, 87: 3275.
[8] Mills A, Giddings S. Inorganica Chimica Acta, 1957, 16: 165.
[9] Randle T H, Kuhn A T. J.Chem.Soc.Faraday trans.I, 1983, 79:1741.
[10] Meada Y, Sato K, Ramaraj R. Electrochimica Acta, 1999, 44: 3441.
[11] Bishop E, Cofve P. Analyst, 1981, 106: 316.
[12] Randle T H, Kuhn A T. Austr.J.Chem., 1989, 42: 229.
[13] Randle T H, Kuhn A T. Austr.J.Chem., 1989, 42: 1527.
[14] Klekens P. Steen L, Ponche H. Electrochim Acta, 1981, 26: 841.
[15] Kuhn A, Randle T H. J.Chem.Soc. Faraday Trans.I, 1985, 81: 403.
[16] Bonewitz R A, Schmid G M. J.Electrochem Soc., 1970, 117: 1367.
[17] Zingales R. J.Chem.Soc. Dalton trans., 1990, 229.
[18] Pleecher D, Valdes E M. Electrochim.Acta, 1988, 33: 499.
[19] Kunz A H. J.Am.Chem.Soc., 1931, 53: 98.
[20] Bard A J,Faulkner L
R. Electrochemical Methods - Fundamental and application, NewYork: John Whily & Son
Inc., 1980.
[21] Sum E, Skyllas-Kazacos M. J.Power Sources., 1985, 15: 179.
[22] Kuhn A T, Randle T H. J.Chem.Soc. Faraday Trans., 1985, 81: 403.