http://www.chemistrymag.org/cji/2003/058062pe.htm |
Aug. 1, 2003 Vol.5 No.8 P.62 Copyright |
Zhao Yanyan a,b, Yang Gengliang b,c*,
Fan Zilin b, Liu Haiyan b, Chen Yi c
(
Abstract The protein binding constants, binding sites and binding rate of an acid drug, N-(trans-4-isopropylcyclohexylcarbonyl)-D-phenylalanine (NDP) in human plasma albumin (HPA) solution were studied by HPCE/FA. The methods of separating an acid drug from HPA by HPCE/FA were established. The experiments were carried out by determining unbound drug concentration in drug-protein equilibrium solution in an uncoated fused silica capillary (40 cm �� 50
mm ID; effective length 32 cm) for capillary electrophoresis under the following conditions: background solution, sodium phosphate buffer (pH7.4, ionic strength 0.17); UV detector, wavelength 214nm; hydrostatic injection mode and the injection time 100s; run voltage 18kV. The unbound drug concentration was calculated from the plateau height of the profile with good linear relation, r>0.999 for it (N=6). The influence of different protein concentration on the protein binding was investigated while the drug concentration (200mmol/L, 250mmol/L) was fixed. Similarly, the effect of different drug concentration on protein binding was also studied while the protein concentration (100mmol/L) was fixed. The experimental data were fitted by a non-linear least-squares curve fitting program and binding parameters were obtained simultaneously. The reproducibility of the data determined by HPCE / FA was confirmed by RSD (RSD < 2.5 %, n=3).Keywords Acid drug, Protein binding parameters, Capillary electrophoresis, Frontal analysis
1. INTRODUCION
The interaction of drug molecules and the biopolymers, especially plasma albumin in
the body directly affects the drug distribution in the body and its pharmacodynamics and
pharmacokinetics. It has become attractive in study on the field of pharmacy and
analytical chemistry. The conventional methods of using HPLC and spectrophotometry include
equilibrium dialysis, ultrafiltration, dynamic dialysis, etc. However, there are many
limitations, in these methods, such as, the need of a large amount of samples, drug
absorption onto the filtra-membrane, leakage of bound drug through the membrane, some
constituents in the membrane dissolved in the solution and Donnan effect (As both the
protein and the drug are charged, the drug concentration on each side of the membrane is
not the same)[1].
Hunnel-Dreyer[2-3], vacancy peak[4], and frontal
analysis (FA)[5] of chromatography had been used by Sebille et al and
partial-filling technique[6-8] had been used by Amini et al in the study of
drug and protein binding, in which samples can be injected directly without being
pretreated. The above-mentioned methods were also utilized by Poppe et al[9-10]
to capillary zone electrophorisis (CZE), in which only a little sample of drug-protein
mixed solution was needed. Recently, HPCE/FA has become an attractive technique in the
drug-protein binding study because it shows the advantages of both FA and HPCE and
overcomes the weakness of the conventional methods. HPCE/FA is suitable for the analysis
of weak protein binding, which requires a relatively large injection volume with
ultramicro(100nl) sample injection volume or nanmolar sample concentration. It is
especially useful to study the binding of protein which are scarce and difficult to be
obtained, such as a -acidic glycoprotein (AGP) and liporoteins[11-12]. By
HPCE/FA, the unbound drug concentration and the total drug concentration can be determined
simultaneously. The drug peak is completely separated from the protein peak in the body
fluid environment. Thus HPCE/FA has a wide prospect for application in analysis. However,
though the study of basic drug and protein binding by HPCE/FA has been widely reported[11,13],
little attention has been given to that of the acid drug and protein binding by HPCE/FA .
This paper, for the first time, deals with it by HPCE/FA that the
investigation of the binding of HPA and an acid drug,
N-(trans-4-isopropylcyclohexylcarbonyl)-D-phenylalanine (NDP)��which is a new reagent for type- II diabetes.
2.1 Reagents and materials
NDP was provided by Hebei Jiheng Pharmaceutical Co. (Hengshui, China); HPA was from Shuanglin Pharmaceutical Co. Ltd., Co.999 group (Zhanjiang, China); Sodium Dodecyl Sulfate (SDS) was purchased from Zhongxi Reagent Plant (Beijing, China). The other chemical reagents are all of analytical grade.
Sodium phosphate buffer (pH 7.4, ionic strength 0.17), which contains 52.58mmol/L Na2HPO4 and 12.33mmol/L NaH2PO4 prepared with double-distilled water, was used as the background buffer solution (BGS) as well as the sample solvent. It was filtered through 0.45mm filters (Ruili Separation Instrument Factory, Shanghai, China) prior to use.
2.2 Apparatus
The experiment was performed on a Waters Quanta 4000 capillary electrophoresis system (Milford, MA, USA) with a built-in 0-30KV high voltage power supply, a fixed wavelength UV detector near the cathodic end and a forced-air cooling system. Uncoated fused capillary with 50mm ID, 40 cm total length and 32 cm effective length was from Yongnian Optical Factory, Hebei Province, China. pH-3C acid meter was from Leici Factory, Shanghai, China. The UV detector wavelength was set at 214nm. Data processing was carried out with a Waters Millennium 2010 chromatography system. The sensitivity of the detector was set at 0.005AUFS.
2.3 Procedures
A series of different concentration NDP-HPA solutions were made up with BGS (Table.1) and the solutions were shaken 100 times/min at 37ºC for 2h before analysis.
The run voltage was 18 kV, and the sample was injected by hydrostatic mode for 100s. Before a new capillary was used, the capillary was rinsed with 1mol/L NaOH for 20min and double- distilled water for 10min and BGS for 5min. Then the capillary was balanced with BGS for 10min. Between consecutive runs, the capillary was rinsed with 30mmol/L SDS, double-distilled water, and BGS for 3min to obtain good reproducibility respectively.
The unbound drug concentration ([D]f ) and total drug concentration ([D]t ) were calculated respectively from the plateau height and the peak area (Table 1). The influence of different protein concentration on the protein binding was investigated with the drug concentration (200mmol/L, 250mmol/L) fixed. Similarly, the effect of different drug concentration on protein binding was also recorded with the protein concentration (100mmol/L) fixed. The experimental data were fitted with a non-linear least-squares curve fitting program and binding parameters were obtained simultaneously (Fig 4) . 3. RESULTS AND DISCUSSION
3.1 Effect of voltage
Generally, as the isoelectric point of albumin is 4.9, it shows negative charge in BGS. Basic drug, on the other hand, is positive charged in the same buffer. The separation of basic drug and HPA can be carried out by their different migration direction under the electric field. But for acid drug, such as NDP, because it is also negative charged in the BGS, it will be difficult to separate it from HPA. In this study, different run voltages ( 13-19kV ) were applied to investigate the effect of voltage on the separation of drug and HPA. In Fig 1, it showed that the resolution of NDP and HPA was improved with the increase of voltage and the best result was obtained when the voltage is 18 kV.
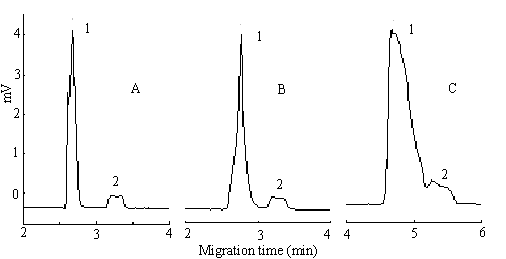
Fig.1 The relation between run voltage and NDP-HPA separating effect. Run voltage, (A) +18kV; (B) +17kV; (C) +14kV; (1) 150mmol/L HPA; (2) 350mmol/L NDP. The other electrophoresis conditions: BGS, sodium phosphate buffer solutuion ( pH 7.4; ionic strength, 0.17 ); uncoating capillary, 50 m ID��40cm (effective length, 32cm); UV detector wavelength, 214nm; Injection time 100sec; gravity injection and the injection height was 12cm.
3.2 Effect of capillary pretreatment
Rinsing method of the capillary is an important factor for the reproducibility. When the
column was only rinsed with 1mol/L NaOH, H2O and running buffer, very poor
reproducibility were obtained. When 1mol/L NaOH is replaced by SDS to rinse column, the
reproducibility becomes better. This indicated that the absorption of protein on the
column was decreased by SDS. Through the investigation of different concentration SDS,
30mmol/L SDS is the optimum concentration for the rinsing procedure. The reproducibility
data were: tR: RSD <1.0%, area:
RSD<2.5%, height: RSD< 2.0% (n=3).
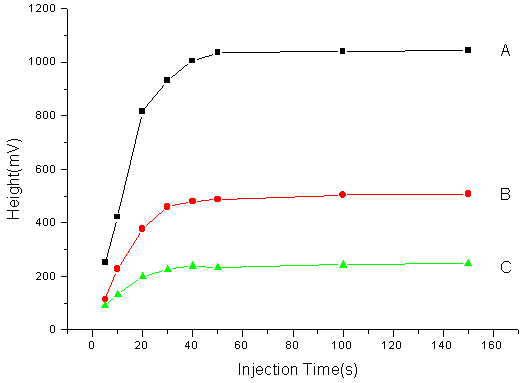
Fig 2.The relation between injection time and the
appearance of plateau zone. (A) 200
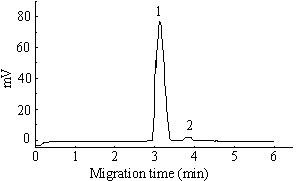
Fig 3. Electropherograms of NDP and HPA mixed
solution. (1) 150
3.3 Effect of sample injection time
(sample volume)
In the experiment, the relation between the appearance of plateau zone and a series of
injection time ( 5s, 10s, 30s, 50s, 80s, 100s, 200s) was studied when the different
concentrations of different drugs were used. Whatever drug it is, acid or basic and
whatever concentration it is , when capillary is fixed ( 40cm��50��m ID), the plateau appears while sampling at about 50s, which is
thought as the minimum injection time (MIT) in HPCE/FA. When the injection time is less
than 50s, the height rises with the increase of injection time, when the injection time
was above 50s, the plateau height remains unchanged but its plateau gets wider and wider
with the increase of injection time. When the injection time was 100s, the reproducibility
is the best (See Fig 2). The electropherogram of the NDP-HPA equilibrium solution was
shown in Fig 3.
3.4 Calibration Line
The calibration lines were obtained by measuring the plateau height of a series of NDP
standard solutions of different concentration, from 25��mol/L to 500mmol/L, which was dissolved in BGS and determined under above
electropherogram condition. The linear regression equation is:
Y = -21.8159+7.7867 C ( r = 0.999, N = 6 )
(1)
where Y represents the height of the plateau and C, the concentration of the sample.
The result shows that there is a good linear relation in the
concentration range from 25��mol/L to 500��mol/L.
3.5 Determination of the drug and protein binding parameters
Drug-protein binding equilibrium is a rapid and reversible process
![]() .
.
The equilibrium relation accords with the multiple equilibrium theory[14-15],
which can be expressed by the following equation:
 (2)
(2)
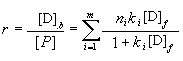
In Eq. (2), r means the drug molecules number that each protein molecule binds, and
the ratio of the bound drug concentration ([D]b) to the unbound protein
concentration ([P]), [D]f is the unbound drug concentration, k
is the drug-protein binding constant, and ni indicates the number of the
binding sites in the class i on one protein molecule, m is the class number
of binding sites.
No matter how many drug-protein binding sites (n) there are, m=1 if
drug has the same affinity for all the binding sites, which conforms with Mon-Laungmuir
isotherm [14-15].
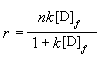 (3)
(3)
When r was plotted against [D]f, it was found that the experimental data could
be fitted with a non-linear least-squares curve fitting program, which accords with
bi-Langmuir isotherm model and binding parameters were obtained simultaneously (Fig 4).
Fitting the equation is:
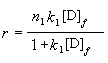
 (4)
(4)
In it, n1= 6, k1=4.6��10-4; n2=1, k2=3.7��10-2.

Fig 4 Non-linear regression curve for determining
NDP-HPA binding parameters. (A) Mon-Langmir isotherm; (B) Bi--Langmir isotherm.
Electrophoresis conditions are the same as those in Fig 3.
The result showed that in HPA, there were two class binding sites (n1,
n2) and two class binding constants (k1, k2), having
different affinity for NDP. In one binding site (n=1), there was stronger affinity (K=3.7��10-2
) and in other six binding sites (n=6), there was weaker affinity (K=4.6��10-4)
with NDP.
The binding rates of drug-protein (��) were calculated based on the following equation [16]:
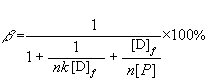 (7)
(7)
The results are
shown in Table 1.
Table 1 Drug-protein binding rates of NDP in HPA solution determined by HPCE/FA
HPA�CNDP |
[D]f |
r |
1/k1n1[P] |
[D]f/n1[P] |
b 1% |
1/k2n2[P] |
[D]f/n2[P] |
b2 % |
350-150 |
21.87 |
0.3544 |
0.1252 |
0.0504 |
85.06 |
0.3368 |
0.0148 |
73.98 |
300-200 |
31.20 |
0.4518 |
0.1460 |
0.0839 |
81.30 |
0.3930 |
0.0246 |
70.54 |
250-200 |
48.88 |
0.5866 |
0.1753 |
0.1577 |
75.02 |
0.4716 |
0.0463 |
66.88 |
200-250 |
96.39 |
0.7904 |
0.2191 |
0.3887 |
62.20 |
0.5895 |
0.1142 |
58.70 |
100-250 |
152.85 |
0.9935 |
0.4382 |
1.2326 |
37.44 |
1.1789 |
0.3622 |
39.35 |
150-350 |
182.35 |
1.1306 |
0.2921 |
0.9804 |
44.00 |
0.7860 |
0.2880 |
48.22 |
100-550 |
373.27 |
1.8104 |
0.4382 |
3.0102 |
32.48 |
1.1790 |
0.8845 |
32.64 |
When the drug concentration (200
mmol/L, 250mmol/L) is fixed, the protein binding rate increases with the increase of protein concentration. On the contrary, when the protein concentration (100mmol/L) is fixed, with the drug concentration increases, the protein binding rate tends to decrease. The experimental results indicate that different protein concentration and different drug concentration have different drug-protein binding rate. It is of practical significance that the unbound drug concentrations determined practically should be used to calculate drug-protein rate when the treatment concentration of a drug is well known, or when drug-protein concentration gets equilibrium in the body.4 CONCLUSIONS
This paper presents an effective method to study acid drug-protein binding by HPCE/FA. The unbound drug concentration and the total drug concentration can be determined simultaneously by HPCE/FA. Experiments show that HPCE/FA is an easy, accurate method for pharmacokinetics and pharmacodynamics study of the drug.
REFERENCES
[1] Juntian, Zhang. Modern Experimental Methods in Pharmacology Beijing:
Beijing Medical University & Chinese Medical University Union Press, 1998: 1669.
[2] Hunnel J P, Dreyer W J. Biochim. Biophys. Acta, 1962, 63: 530.
[3] Sebille B, Thuaud N, Tillement J P. J. Chromatogr, 1978, 167: 159.
[4] Sebille B, Thuaud N, Tillement J P. J. Chromatogr, 1979, 180: 103.
[5] Soltes L, Sebille B, Tillement J P et al. J. Clin. Chem. Clin. Biochem, 1989, 27: 935.
[6] Amini A, Westerlund S. Anal Chem., 1999, 70: 1425.
[7] Heintz J, Hernandez M, Gromez F A. J. Chromatogr A, 1999, 840: 261.
[8] Zhang Y, Gromez F A. J. Chromatogr A 2000, 897: 339.
[9] Kraak J C, Busch, S, Poppe H. J. Chromatogr, 1992, 608: 257.
[10] Busch M H A, Boelens H F M, Kraak J C. J. Chromatogr A, 1997, 775: 313.
[11] Shibukawa A, Yoshimoyo Y, Ohara T et al. J Pharma Sciences, 1994, 83 (5): 616.
[12] Shiono H, Shibukawa A, Kuroda Y et al. Chirality, 1997, 9: 291.
[13] Rosas M E R, Shibukawa A, Yoshimoyo Y et al. Anal. Sci., 1999, 15: 217.
[14] Klotz I M, Hunston D L. Biochemistry, 1971, 10: 3065.
[15] Feldman H A. Anal.Biochem., 1972, 48: 317.
[16] Goldstein A, Aronow L, Kalman S M. Principles of Drug Action, 1981: 114.