http://www.chemistrymag.org/cji/2005/07c083pe.htm |
Dec. 2, 2005 Vol.7 No.12 P.83 Copyright |
Li
Zhengping, Liu Chenghui, Su Yuqin, Duan Xinrui
(College of Chemistry and Environment Science, Hebei University, Baoding 071002)
Abstract: The hydrophobic interaction
between protein and 8-anilino-1-naphthalenesulfonic acid (ANS) can lead to the
fluorescence enhancement of ANS. Therefore, ANS is widely used as a fluorescent probe for
structure investigation and quantitative determination of proteins. In this article, the
binding mechanism between protein and ANS was studied by resonance light scattering (RLS)
and fluorescence spectra. It was found that only at certain pH ranges the hydrophobic
interaction was the dominant binding modes between ANS and protein. When pH value is near
4.1, protein will bind ANS mainly through the electrostatic interaction, which can result
in strongly enhanced RLS intensity of ANS. So ANS may be used as an electrostatic probe to
study the electrostatic interaction between protein and small molecules with RLS
technique. The enhanced RLS intensity at 452 nm was proportional to the concentration of
bovine serum albumin (BSA) in a range of 0.01-6.0 mg/ml and the detection limit (3s) of BSA was 3.0 ng/ml. By using ANS as a probe, the proposed RLS
method has about an order of magnitude higher sensitivity for protein determination
compared to that of fluorescent method.
Keywords Resonance light scattering (RLS);
8-anilino-1-naphthalenesulfonic acid (ANS); Bovine serum album (BSA); Binding mechanism
As organic dyes can serve as effective probes of the quantitative determination or structure character investigation for biological macromolecules, interest is increasing in the studies on the interactions of organic dyes with biological macromolecules. A variety of methods by using organic dye probes have been applied to detect proteins, such as spectrophotometry [1], fluorimetric method [2] and the recently developed resonance light scattering (RLS) method.[3] Mechanism studies showed that the RLS was generally due to the aggregation of a large amount of dye molecules on the surface of the biomacromolecules [4] and this method has been extensively studied and applied to solve many problems in recent years. Earlier works about RLS method were well reviewed by Huang and Li. [5]
The 8-anilino-1-naphthalenesulfonic acid (ANS) is a widely utilized fluorescent "hydrophobic probe" for examining the nonpolar character of proteins. Weber G et al. firstly detected the hydrophobic sites of bovine serum albumin (BSA) using ANS as a fluorescent probe,[6] then ANS was applied in many related ways, such as in the detection of "molten globule" [7] and nonpolar surface patches of proteins[8], as a back-titration fluorescence indicator for lipid molecule displacement from lipid carrier proteins. [9] Earlier works had been done to study the interaction between ANS and proteins, and it was well accepted that interaction between protein and ANS was through hydrophobic interaction and the enhancement of the fluorescence intensity was resulted from the hydrophobic binding [6]. In this article, the binding modes between ANS and proteins were studied by comparing the fluorescence spectra and the RLS spectra at different pH values. The results indicated electrostatic binding was also a main mode between ANS and proteins besides hydrophobic binding and the dominant mode varied when the pH value changed. It was also found that the electrostatic binding resulted in strongly enhanced RLS intensity and the enhanced RLS intensity of ANS by BSA was proportional to the concentration of the BSA under optimum conditions. Based on this phenomenon, a new method to determine the concentration of BSA using ANS as a RLS probe was established. The sensitivity of the proposed method was higher than that of the method using ANS as a fluorescent probe [6,10]. 2. EXPERIMENTAL
2.1 Apparatus
A Hitachi F-4500 fluorescence spectrophotometer (Tokyo, Japan) was used to measure and record the fluorescence spectra and the RLS spectra. A pHS-3C pH meter (Shanghai, China) was used to control the acidity of the solutions and a WH-861 vortex mixer (Taicang Instrumental Co., Jiangsu, China) was used to blend the solutions.
2.2 Reagents
BSA was purchased from Sigma, which was dissolved at a concentration of 50.0 mg/ml as stock solution and stored in a refrigerator at 0- 4oC. ANS was purchased from the Tokyo Kasei Kogyo Co., Ltd. The stock solution was 440.0 mmol/L and diluted when necessary. The Britton-Robinson (B-R) buffer was used to control the acidity of the solution. All other reagents were of analytical grade. Doubly distilled and deionized water was used throughout.
2.3 Standard procedure
A certain volume of ANS solution and 2.0 ml B-R buffer were added to a 10.0 ml colorimetric tube and then an appropriate volume BSA solution was added, the mixture was diluted to the mark and mixed thoroughly using the vertex mixer. The fluorescence spectra were measured with excitation wavelength at 280 nm. The RLS spectra were measured by scanning synchronously with the same excitation and emission wavelength in the wavelength range of 200 nm to 700 nm. The slit width and PMT voltage of the measurements were 5 nm and 400 V respectively.
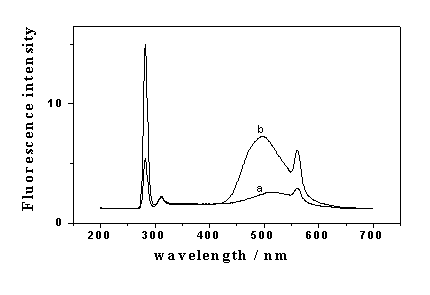
Fig. 1 Fluorescence spectra of ANS in the absence (a) and presence (b) of BSA.
ANS, 22.0 mmol/L; BSA, 5.0 mg/ml; pH 1.8.
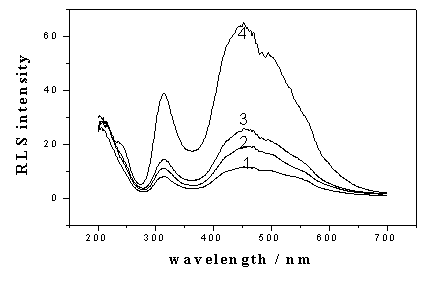
Fig. 2: RLS spectra of ANS in the presence of BSA of different concentration.
ANS, 88.0 mmol/l; pH 4.1; the concentration of BSA (mg/ml): 1, 0; 2, 0.1; 3, 0.5; 4,1.0.
3. RESULTS AND
DISCUSSION
3.1 Characteristics of fluorescence spectra and RLS spectra
As shown in Fig. 1, ANS has a very weak fluorescence peak at 515 nm at pH 1.8. However,
when BSA was added in, the fluorescence intensity was significantly enhanced accompanied
with the blue shift of the peak to 495 nm. The excitation wavelength used was 280 nm, so
the light scattering peak at 280 nm and secondary light scattering peak at 560 nm can be
seen. Then the RLS spectra were investigated at pH 4.1. As shown in Fig. 2, there were two
RLS peaks at 309 nm and 452 nm respectively, which were strongly enhanced by the addition
of BSA.
By comparing Fig. 1 and Fig. 2, it can be seen that the RLS intensity
had much higher signal than the fluorescence intensity. The ratios of signal-to-background
for fluorescence with 5.0 mg/ml BSA and for RLS with 0.5 mg/ml
BSA were 2.4 and 2.2, respectively. The results indicated that the RLS method had about an
order of magnitude higher sensitivity for protein determination compared to that of the
fluorescence method by using ANS as a probe.
3.2 Influence of pH on the fluorescence intensity and RLS intensity
The influence of pH on the fluorescence intensity and RLS intensity of ANS enhanced by BSA
was investigated in the range of pH 1.8-11.0. The B-R buffer solution was used to adjust
the pH values. Figure.3 showed the influence of pH on the enhanced fluorescence intensity
(DF). It can be seen from Fig.3 that the DF declined
with increasing pH until pH 5.0 and then had a little increase in the pH range of
5.0-11.0. The phenomenon can be explained by the accepted fact that the DF was
resulted from the hydrophobic binding between BSA and ANS. The BSA molecule in pH 4.0-11.0
is compact and moderately hydrated, so the molecules were not likely to have major
conformational changes which may reflect on the number of the hydrophobic binding sites,
so the DF had no significant change. When the pH was below 4.0, the
BSA molecules may engage in well-characterized conformational expansion that resulted in
more hydrophobic binding sites.
The influence of pH on the RLS intensity of ANS enhanced by BSA (DIRLS)
was shown in Fig.4. In the pH range of 1.8- 4.1, the DIRLS increased till 4.1
where it had a maximum value, then it declined sharply from pH 4.1 to 5.0 and the DIRLS
was very weak and stable in the range of pH 5.0-11.0.
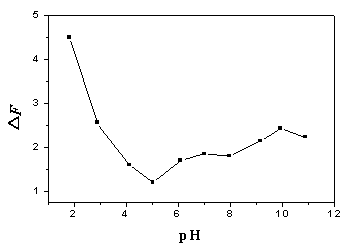
Fig. 3 Influence of pH value on the
enhanced fluorescence intensity (DF).
Excitation wavelength (lex), 280 nm; Emission wavelength (lem), 495
nm; ANS concentration, 22.0 mmol/L; BSA concentration, 5.0 mg/ml.
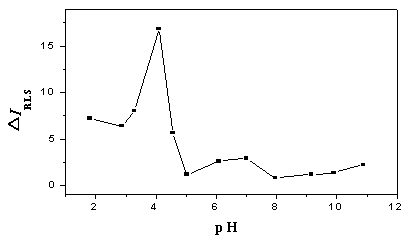
Fig. 4 Influence of pH value on the enhanced RLS intensity (DIRLS).
lex
= lem
= 452 nm; ANS concentration, 22.0 mmol/L; BSA concentration, 5.0 mg/ml.
As Fig. 3 and Fig. 4 showed, the DIRLS was strong at pH
4.1, but the DF was very weak. From pH 1.8 to pH 4.1, the DIRLS
increased but the DF declined. The results demonstrated that the
fluorescence and RLS enhancement was determined by different binding modes. Since the DF
was resulted from hydrophobic binding, thus the hydrophobic binding mode had little effect
on the DIRLS. As uncharged hydrophobic amino acid residue
and charged hydrophilic residue both exist in the protein molecules, and hydrophobic
naphthyl and aniline groups and hydrophilic sulfo groups exist in the ANS molecules, we
can conclude that electrostatic force existed besides hydrophobic forces between ANS and
BSA molecules and the DIRLS was resulted from electrostatic
binding mode.
The conclusion that the electrostatic binding is the decisive factor
for the enhanced RLS can be proved by the tendency of the Fig. 4. The electrostatic force
was governed by the relation of pH to the pI (isoelectric point) of BSA and in turn to the
number of positive charges on the protein molecules. The pI of the BSA was 4.7, when the
pH value is below 4.7, the amino acid side chains of BSA molecules were cationic, and the
carboxyl groups were neutralized to their COOH form. The sulphonic groups of ANS were
negatively charged when the H+ dissociated, so the ANS and the BSA molecules
can bind tightly through electrostatic forces. In the pH range below the pI of BSA, as the
pH increased, there were more negative charges in the ANS molecules which made for the
binding process, while the number of the positive charges in BSA molecules amino acid side
chains decreased which went against the binding. The two opposite factors both functioned
in the binding process. As a result, the strongest ionic interaction formed at the pH 4.1,
thus the maximum number of ANS molecules assembled on the BSA molecules. So the RLS
intensity was significantly enhanced to its maximum value. To the contrary, in alkaline pH
above the pI of BSA, both the BSA molecules and the ANS molecules were negative charged.
They repulsed each other, which made the molecules of BSA and ANS difficult to bind by
electrostatic forces, so the RLS enhancement was very weak.
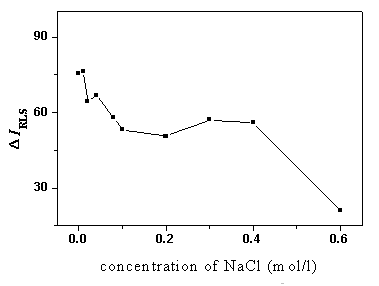
Fig. 5 The influence of ionic strength on DIRLS.
pH 4.1; BSA, 5.0 mg/ml; ANS, 44.0 mmol/L
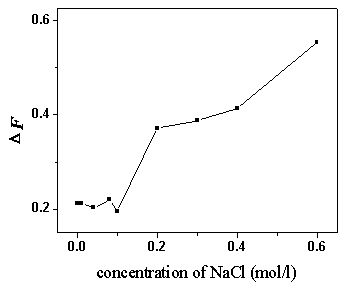
Fig. 6 The influence of ionic strength on DF.
pH 4.1; BSA, 5.0 mg/ml; ANS, 44.0 mmol/L
3.3 Influence of the
ionic strength
The influence of the ionic strength on the enhanced fluorescence and RLS intensity was
studied, in which NaCl was used to control the ionic strength. As shown in Fig. 5, the DIRLS
decreased with the increase of the concentration of NaCl, which also proved our viewpoint
that the electrostatic forces were the dominant form of the binding modes to enhance the
RLS intensity. When NaCl concentration increased, the Cl- competed with ANS to
bind the BSA through ionic interaction, which would reduce the number of ANS molecules
binding on the BSA.
As the ionic strength increased, the DIRLS
declined, while the DF had a slow increase (as shown in
Fig. 6). The reason for the phenomena may be that in the binding system at pH 4.1, the
electrostatic forces were the dominant factor, and the hydrophobic process also existed.
The high ionic strength was advantageous to the hydrophobic process but disadvantageous to
the electrostatic binding. The electrostatic binding and the hydrophobic action had a
cooperative effect. They competed with each other and could transit to each other when the
experimental conditions changed.
Another probable reason for the phenomena was that the electrostatic
aggregation of a large amount of ANS molecules on BSA molecules maybe caused strong
self-absorption of fluorescence, which resulted in fluorescence quenching. The
electrostatic aggregation was weakened when the ionic strength increased, so the
fluorescence intensity increased slowly.
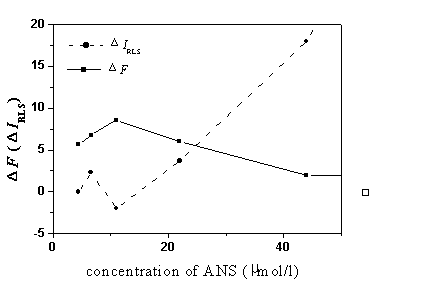
Fig. 7 The influence of the concentration of ANS on the enhanced fluorescence and
RLS intensity at pH 1.8. BSA, 5.0 mg/ml.
3.4
Influence of the concentration of the ANS
At pH 1.8, as the concentration of ANS increased, the tendency of DIRLS
and DF were well reversed with each other (see Fig. 7). It also
demonstrated the competitive effect between the hydrophobic binding mode and electrostatic
binding mode.
The DIRLS increased with the
increase of the ANS concentration at pH 4.1. When the concentration was above 88.0 mmol/l, the increase became very small. In order to have a broader
linear range, 88.0 mmol/l ANS concentration was used in our subsequent work of the
quantitative determination of BSA.
3.5 Determination of BSA using ANS as a RLS probe
3.5.1 Influence of the concentration of the B-R buffer
Under the conditions described above, 0.5 ml-3.0 ml B-R buffer of pH 4.1 were added to the
ultimate 10.0 ml solution, the RLS signals were almost the same. The buffer volume had
little effect on the system. Considering both the ionic strength and the buffer capacity,
2.0 ml buffer volume was selected.
3.5.2 Influence of binding time
The time scanning for RLS intensity showed that the signals were very stable when the
binding time of BSA and ANS in 0-2000 s, which indicated the electrostatic binding was
very strong at pH 4.1. The measurement of each sample was completed within 30 min.
3.5.3 Calibration curves
According to the general procedure, the
linear calibration curve for determination of BSA was constructed under the optimal
conditions mentioned above. There is a good linear relationship between the enhanced RLS
intensity and the concentration of BSA from 0.01 mg/ml to 6.0 mg/ml. The Linear
regression equation was DIRLS=1.5+19.4c (mg/ml)
and the detection limit of BSA was 3.0 ng/ml. The sensitivity of the proposed RLS assay is
superior to the method using ANS as a fluorescent probe [6,10]. The
comparison between the proposed method and other RLS methods for the determination of BSA
was listed in Table 1. As can be seen from Table 1 that the sensitivity of this method was
high.
Table 1 Comparison of the proposed method and other RLS assays for BSA
determination.
| RLS Labels | Detection limit (3s, ng/ml) | Reference |
| Anion porphyrins | 18 | [3] |
| Fast Red VR | 7.1 | [11] |
| Titan Yellow | 12.7 | [12] |
| Thorin | 52.0 | [13] |
| Eriochrome Black T | 39.0 | [14] |
| Colloidal silver chloride | 8 | [15] |
| Chromium hydroxide nanoparticles | 18.6 | [16] |
| ANS | 3.0 | This work |
In this paper, we studied the interaction mechanism between the ANS molecules and BSA by RLS technique. The experimental results showed that electrostatic interaction was also a main binding mode besides the known hydrophobic binding. The hydrophobic binding responded to fluorescence intensity enhancement and the electrostatic interaction caused the enhancement of RLS intensity due to a large range assembly of ANS molecules on the surface of BSA. The dominated mode in the system varied depending on the pH value. In the binding process, the two modes had a cooperative effect, so they contested with each other and could transit to each other when the experimental conditions changed. Thus except as an effective fluorescent probe to detect the hydrophobic binding, ANS can also serve as a powerful probe to investigate the ionic interaction between small molecules and proteins by using RLS technique.
A new assay for quantitative determination of proteins using ANS as a RLS probe was also described. Compared with the method using ANS even bis-ANS as fluorescent probe, the sensitivity of the proposed assay was much higher.
REFERENCES
[1] Bradford M.M., Anal. Biochem., 1976, 72: 248.
[2] Li N., Li K.A., Tong S.Y., Anal. Biochem., 1996, 233: 151.
[3] Huang C.Z., Li Y.F., Feng P., Anal. Chim. Acta., 2001, 443: 73.
[4] Pasternack R.F., Bustamante C., Collings P.J., et al, J Am Chem Soc., 1993, 115: 5393.
[5] Huang C.Z., Li Y.F., Anal. Chim. Acta., 2003, 500: 105.
[6] Daniel E., Weber G., Biochemistry, 1966, 5: 1893.
[7] Semisotnov G., Rodionova N., Razgulyaev O., et al, Biopolymers, 1991, 31: 119.
[8] Cardamone M., Puri N., Biochem. J., 1992, 282: 589.
[9] Kane C., Bernlohr D., Anal. Biochem,, 1996, 233: 197.
[10] Rosen C.G., Pesce A.J., Gaizutis M., Microchemical Journal, 1971, 16: 218.
[11] Yang C.X., Li Y.F., Huang C.Z., Anal. Lett. 2002, 35: 1945.
[12] Wu H.L., Li W.Y., He X.W., Acta Chim. Sin. 2002, 60: 1822.
[13] Chen L.H., Zhao F.L., Li K.A., Chin. J. Chem. 2002, 20: 368.
[14] Li S.W., Li N., Zhao F.L., et al., Chin. J. Anal. Chem. 2002, 30: 732.
[15] Zhu C.Q., Li D.H., Zhu Q.Z., et al., Fresenius J. Anal. Chem. 2000, 366: 863.
[16] Li Z. P., Liu W., Zheng C., Chemical Journal on internet, 2005, 7 (10): 66
应用共振光散射技术研究蛋白质与8-苯胺基-1-萘磺酸的相互作用
李正平1,刘成辉,苏玉芹,段新瑞
(河北大学化学与环境科学学院,河北保定071002)
摘要 蛋白质与8-苯胺基-1-萘磺酸(ANS)之间的疏水作用可导致ANS的荧光增强,因此ANS被广泛用于蛋白质结构研究及定量检测的疏水荧光探针。本文通过共振光散射(RLS)及荧光技术研究了ANS与蛋白质之间的相互作用机理。结果发现只有在一定的pH范围内疏水作用才是二者之间的主要作用力,而在pH
4.1附近蛋白质主要通过静电作用与ANS结合。这种静电作用导致ANS的RLS信号强烈增强。因此ANS可以作为有效的离子作用探针通过共振光散射技术来研究蛋白质与小分子之间的相互作用。另外,452
nm 处增强的共振光散射强度与BSA的浓度在0.01-6.0 mg/ml
范围内成良好的线性,检出限(3s)为3.0 ng/ml。灵敏度要比ANS作为荧光探针高约一个数量级。
关键词 共振光散射,8-苯胺基-1-萘磺酸(ANS),牛血清蛋白,结合机理