http://www.chemistrymag.org/cji/2006/085031pe.htm |
May 1, 2006 Vol.8 No.5 P.31 Copyright |
Influences of acyclovir on the properties of hemoglobin
Liu Tianqing a,b, Guo Rong b(a School of Chemistry and Chemical Engineering, Yangzhou University, Yangzhou, Jinagsu 225002; b School of Chemistry and Chemical Engineering, Nanjing University, Jinagsu 210093, China) Received Mar. 3, 2006; Supported by the National Science Foundation of China (No. 20573091, 20233010). Abstract The influences of acyclovir drug on the properties of hemoglobin (Hb) have been studied by the methods of UV-Vis spectrum, fluorescence spectrum, HPLC, conductivity, zeta potential and negative-staining TEM. The obtained results show that acyclovir can associate with Hb to form a new complex. The association constant and association number of the complex are about 7.6×10⁴ l·mol-1 and 1.25, respectively. The fluorescence of Hb can be quenched by acyclovir. The half-life of the fluorescence quenching is about 8.8min. At higher acyclovir concentration, the quenching process is simultaneously static and dynamic.
Keywords Hemoglobin, Acyclovir, Influence, Property
1. INTRODUCTION
When drug is coming into human body, it must be reserved and transported through human
blood plasma (native protein) to reach at acceptor sites and then to play the role in some
special medication function. All the drugs associate more or less with native human cell
and protein in the blood plasma. The
In human body, hemoglobin (Hb) is one of ordinary proteins, consisting of two identical a-chains of 141 amino acids each, and two identical b-chains of 146 amino acids each [8, 9]. The four subunits corresponded to the myoglobin molecule in their chain conformation are held together at their contacting sites by hydrophobic bonds and salt bridges [10]. Acyclovir (A) is a potent antiviral drug in the treatment of herpes simplex virus (HSV) infections, which is provided with many advantages such as higher selective, effective and low noxious [11,12]. It exerts an antiviral activity by competitive inhibition of viral DNA, through selective binding of acyclovir to HSV-thymidine kinase with about 200-fold greater affinity than for mammalian enzyme. It is also used to treat the disease of SARS. However, there are some side-effects, for instance, nephridium tamper, catarrh and oedema, especially anemia. The mechanism of the side-effects has not been understood [13].
In this paper, the association and the interaction of acyclovir with Hb were investigated to study the mechanism of the side-effects by the methods of UV-Vis spectrum, fluorescence spectrum, HPLC, conductivity, zeta potential and negative-staining TEM. The influences of acyclovir on the properties of Hb are discussed in detail. The investigation may provide some important theoretic information for biologic technology, immunology, medicine, molecular functional design and new drug development.
2. EXPERIMENT
2.1 Materials
Hemoglobin was bought from Shanghai Lizhu Dongfeng Biotechnology Co. Ltd (B.R.),
acyclovir from Hubei Qianjiang Pharmaceutical Co. Ltd (99%, material drug). Doubly
distilled and deionized water was used for the preparation of the solutions.
2.2 UV-Vis spectrum determination
The UV-Vis spectrum and different spectrum of Hb were determined by UV-2550PC UV-Vis
Spectrum Spectrometer (Shimadzu Co., Japan) in different systems.
2.3 Fluorescence spectrum determination
Under the condition of the excitation wavelength of Hb, 280nm, the fluorescence emission
spectrum and the synchronous fluorescence spectrum of Hb were determined by RF-5301
Fluorescence Spectrometer (Shimadzu Co., Japan). The slot widths of the excitation and the
emission were 3nm. In the synchronous fluorescence, the differences between the excitation
wavelength and the emission wavelength, D l , were 15nm and 60nm, respectively.
2.4 High-performance liquid chromatographic (HPLC) determination
The content of the each component in Hb/acyclovir/H2O
system was measured with CLASS-VP HPLC System (Shimadzu Co., Japan) with Model SPD-M10AVP
UV-vis Detectors and Autosampler. The chromatographic data were analyzed using CLASS-VP
chromatographic manager (Shimadzu). The flow-rate was set to 1.0 ml/min. The effluent was
monitored with UV-vis double wavelength detector. The mobile phase: methanol + water.
2.5 Conductivity determination
The system conductivity was measured by DDS-11A Conductormeter (Shanghai No.2
Analytical Instrument Co., China). The calibration of the Conductormeter had been made by
0.01mol× L-1 KCl solution.
2.6 Zeta potential of protein
There are always biggish dimension and some charge for protein. So, the electrophoresis of
protein may be taken on under the condition of electric field. The zeta potential of Hb
was measured by Js-94F Microelectrophoresis Meter (Shanghai Zhongcheng Instrument Co.
China). The principle of method of the zeta potential measurement was similar to the
reference [14]. The measured voltage was 10~30V, the stabilizing time
2.7 Circular dichroism measurement
Circular dichroism (CD) measurement was carried out with J-810 Spectropolarimeter (Jasco Co., Japan). The scanning rate was set at 100nm/min. The secondary structure parameters of Hb were analyzed using the curve fitting method of the CD spectrum with the Jasco secondary structure manager.
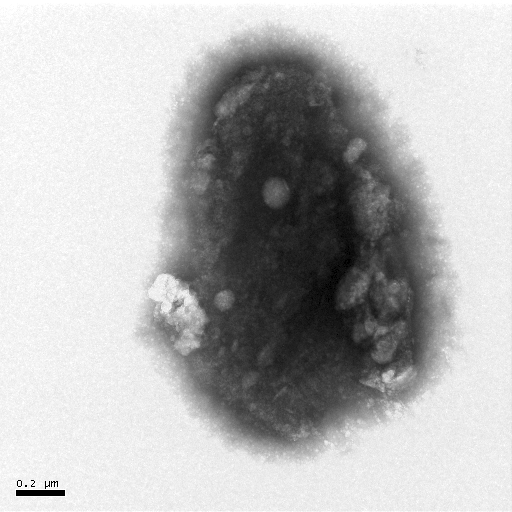
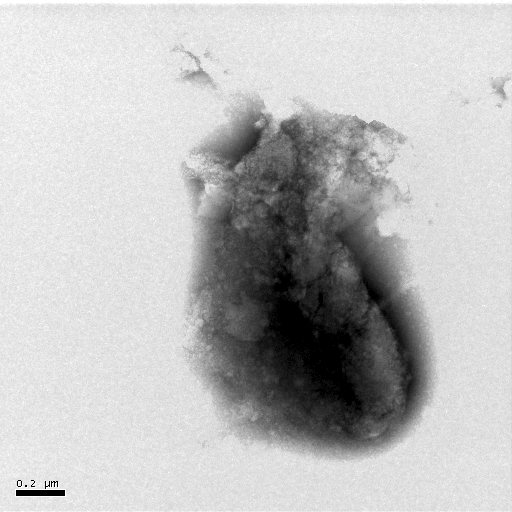
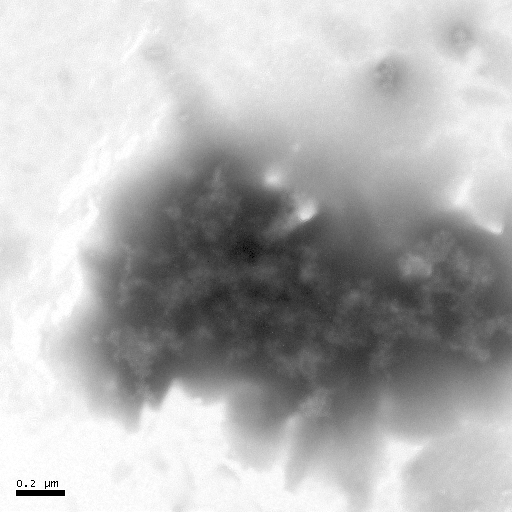
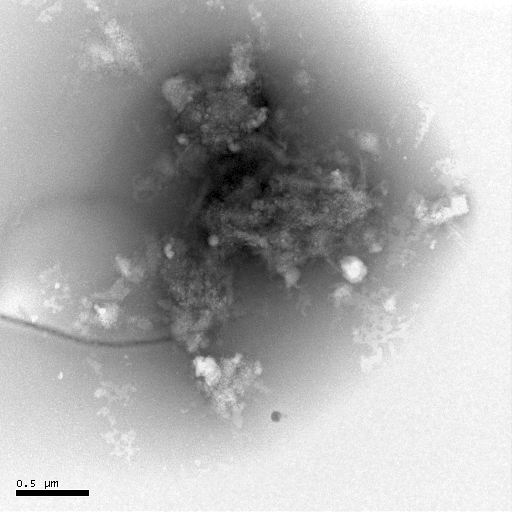
2.8 Negative-staining TEM of protein
The size and morphology of particle is determined by transmission electron microscopy (TEM) [15]. Because a biology and organism always composed of light elements, the image contrast is very weak by using TEM observation. Negative-staining technology can overcome the weak image contrast. The sample was dropped with Hb into the copper mesh grids with the Formvar film. After the sample was adsorbed on the Formvar film about 15~20min, drip staining solution (example phosphor tungstenic acid, PTA) on the Formvar film with Hb. The staining time was about 1~2min. The copper mesh grid was dried with light. The size and morphology of the protein Hb were clearly observed by TECNAIR Transmission Electron Microscopy (Philip Apparatus Co., USA).
All of the above measurements were carried out at 25± 0.1ºC. The pH of the sample is 7.0. All the solutions with protein must be set for at least 30min for the interaction equilibrium. 3. RESULTS AND DISCUSSIONS
3.1 Effect of acyclovir on UV-vis absorbance of Hb
The intrinsic UV-vis absorbance peak of Hb at 276nm is mainly aroused by tryptophan and tyrosine in the Hb peptide. The bands at ~576, 536, and 406 nm correspond to a , b , and Soret g bands in the visible region, respectively [16]. The peak at 406nm also corresponds to the S-band of metHb. The peak of hemichrome is at 500nm. The peak at 630nm corresponds to hemachrome monomer, metHb also [17]. The molar absorptivities calculated from Figure 1 at 252nm, 276nm, 406nm, 500nm and 630nm are 2.260×10⁴, 9.629×10⁴, 4.558×10⁵, 2.527×10⁴ and 1.225×104 cm-1 mol-1 L-1, respectively.
When acyclovir is added to 5×10⁻⁶ mol× L-1 Hb, the UV-vis spectrum does not change among 300nm~700nm (Figure 1). This result shows that acyclovir may not affect the structures of metHb and hemichrome. But a new small peak appears at 263nm, which indicates that acyclovir can associate with Hb to form a new complex.
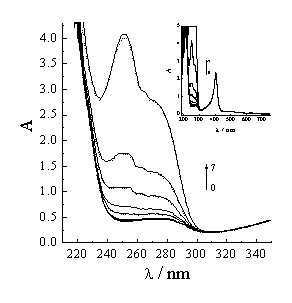
Figure 1 UV-Vis spectra of acyclovir-Hb system vary with acyclovir concentration. Hb concentration is 5×10⁻⁶ mol× L-1. Acyclovir concentrations change from 0 to 5×10⁻⁵ mol× L-1 (0- 0, 1- 1×10⁻⁷, 2- 2.5×10⁻⁷, 3- 1×10⁻⁶, 4- 5×10⁻⁶, 5- 1×10⁻⁵, 6- 2.5×10⁻⁵, 7- 5×10⁻⁵). Solid line and dash line correspond to the UV-Vis spectra after 30min and 49h. The insert chart is the UV-Vis spectra among 190-720nm.
The UV-vis absorbance peaks of acyclovir are at 252nm and 276nm. The more acyclovir concentration is, the more the absorbance intensities of the two peaks (Figure 1). But each of the intensity in acyclovir/Hb/H20 system is less slightly than that in acyclovir/H20 system in the same acyclovir concentration. Owing to hydrogen bonding and hydrophobic action between acyclovir and Hb, acyclovir may be adsorbed on the Hb surface or entered into the Hb cavity. The complex changes the microenvironments of Hb and acyclovir. So, the absorbance intensities decrease in acyclovir/Hb/H20 system to the extent of 5~6%. This implies that the percentage of the acyclovir entered into the cavity is 5~6%. From the result of the high-performance liquid chromatographic (HPLC) for the detection of acyclovir and Hb, it can be seen that the percentage of free acyclovir is 58~63%, and the percentage of the acyclovir-Hb complex is 5~7% in acyclovir/Hb/H20 system. Therefore, the percentage of the acyclovir adsorbed firmly on Hb surface is 30~35%.
3.2 Effect of acyclovir on electric properties of Hb
The zeta potential of protein and the conductivity display its size and charge, property of the double layer. The isopoint of Hb is 6.5. With the increase of acyclovir concentration, the zeta potential of Hb first increases rapidly but the system conductivity decreases in acyclovir/Hb/H20 system (Figure 2). The partial positive charge of NH2 group in the guanine nucleoside of acyclovir can adsorb on the protein surface to decrease and shield the negative-charge of the Hb surface. The potential of the Hb surface increases. The conductivity decreases. On the other hand, the associating complex of Hb with acyclovir also makes the surface charge of Hb to be shielded. The zeta potential goes up. When acyclovir concentration is much higher than the Hb concentration (5×10⁻⁶ mol·L-1), the association is nearly saturated. The Hb charge and the volume of the complex vary little correspondingly. The conductivity changes slowly.
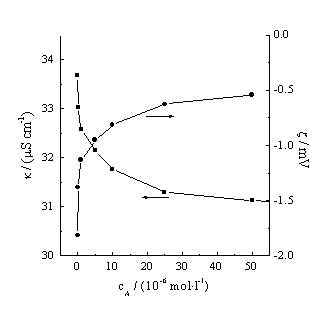
Figure 2 Zeta potential of Hb and conductivity of Hb/acyclovirH2O system vary with acyclovir concentration. Hb concentration is 5´ 10-6 mol× L-1.
3.3 Effect of acyclovir on fluorescence of Hb
The intrinsic fluorescence of Hb (at 333.6nm) can be quenched by acyclovir. According
to Stern-Volmer equation [16, 18-20]:
![]() (2)
(2)
F and F0 are the fluorescence intensity with and without
quencher. cQ is quencher concentration. kq is fluorescence quenching constant.
t 0 is the fluorescence life of fluorescence substance without quencher,
normally 10-8s-1 for bio-molecule [20]. K is a constant,
equaling to the reciprocal of the quencher concentration when the fluorescence intensity
decreases to a half. For dynamic quenching, K is called Stern-Volmer constant KD,
corresponding with the ratio of bi-molecule quenching constant to monomer-molecule
disassociating rate constant. For static quenching, K is the association constant KS
of the complex.
(a)
(b)
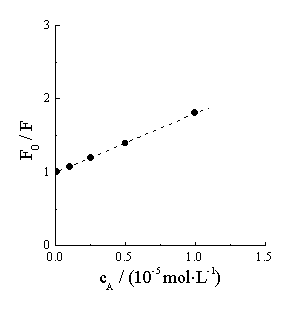
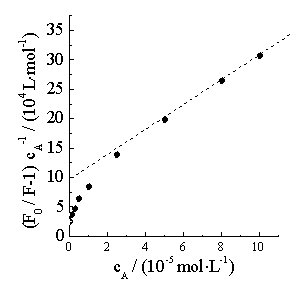
Figure 3 Fluorescence intensity of Hb varies with acyclovir concentration
(at 333.6nm). Hb concentration is 5×10⁻⁶ mol× L-1.
Generally, the hydrophobic cleft on globulin surface can accept 1~2 ligands [20]. The association constant KS and the association number n of the complex can be also calculated from the following equation [21],
From a plot of lg(F0/F-1) against lgcA, KS and n are 7.52×10⁴ l·mol-1 and 1.25 respectively. It is reasonable that one Hb molecule can associate with 1.25 acyclovir molecules to form the complex.
In higher acyclovir concentration, F0/F does not present linearity with cA, but the plot of (F0/F-1)/cA against cA is linearity (Figure 3b). Therefore, the quenching process is provided simultaneously with static and dynamic quenching. From the integration theory (static and dynamic theory) [22], the parameters in the static quenching and dynamic quenching can be gained from Figure 3b, which are 7.603×10⁴ l·mol-1 and 2.982×10⁴ l·mol-1, respectively.
From the experimental relation of the fluorescence intensity with time, the quenching half-life is 8.809min, and the quenching rate constant is about 0.0787 min-1 in 5×10⁻⁶ mol·L-1 Hb and 1×10⁻⁵ mol·L-1 acyclovir. After about 30min, the fluorescence intensity, the zeta potential of Hb and the system conductivity all change experimentally very little with time. The interaction between acyclovir and Hb reaches to an equilibrium.
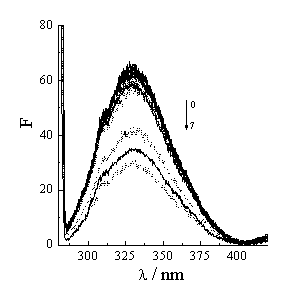
Figure 4 Fluorescence spectra of Hb vary with acyclovir concentration. Hb concentration is 5×10⁻⁶ mol·L-1. Acyclovir concentrations change from 0 to 1×10⁻⁴ mol·L-1 (1- 0, 2- 1×10⁻⁷, 3- 1×10⁻⁶, 4- 5×10⁻⁶, 5-1×10⁻⁵, 6- 5×10⁻⁵, 7- 1×10⁻⁴). Solid line and dash line correspond to 25ºC and 37ºC.
The effect of temperature on the quenching process of acyclovir to Hb may further approve that the process is from static quenching to the integration with static and dynamic quenching. Generally, the increase of system temperature makes the fluorescence intensity and fluorescence efficiency decrease [20,23]. On one hand, when the temperature rises, the molecular vibrational energy increases. The molecular energy in the exciting state and the ability of absorbance quanta all change. The more non-radiancy transition results in fluorescence efficiency decreasing or quenching. On the other hand, the higher temperature is, the higher the molecular movement is, the lower the system viscosity is, the more the molecular collided opportunity is, the lower the fluorescence intensity is [23,24]. Figure 4 is the fluorescence spectra of Hb with acyclovir concentration at 25ºC and 37ºC. With the increase of the temperature, the fluorescence intensities increase slowly in low acyclovir concentration but decrease obviously in high acyclovir concentration. First, the increase of the temperature leads to the stability of the acyclovir-Hb complex and the static quenching decrease. The fluorescence intensity increases. Second, the increase of the temperature arouses the collided opportunity of each molecule and the dynamic quenching to increase. The fluorescence intensity decreases. Therefore, the fluorescence intensities change slowly with the temperature in low acyclovir concentration. In high acyclovir concentration, the dynamic quenching is dominant.
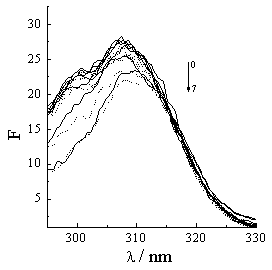
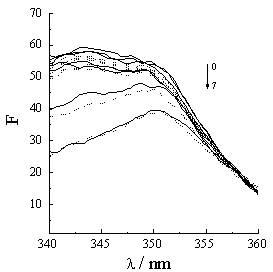
The synchronous fluorescent spectra of a protein at D l =15nm and D l =60nm indicate the microenvironments of the tryptophan and tyrosine in the protein [24]. If a molecule associated with protein can quench the fluorescences of the tryptophan and tyrosine, the tryptophan and tyrosine must locate or approach at the association site [21,25]. Figure 5 shows that the fluorescence spectra of the tryptophan and tyrosine residues drop and the maximal peak take place Einstein shift with acyclovir concentration increasing. So, acyclovir is associated with Hb.
(a) (b)
Figure 5 Synchronous fluorescence spectra of Hb vary with acyclovir concentration. Hb concentration is 5×10⁻⁶ mol·L-1. Acyclovir concentrations change from 0 to 5×10⁻⁵ mol·L-1 (0- 0, 1- 1×10⁻⁷, 2- 2.5×10⁻⁷, 3- 1×10⁻⁶, 4- 5×10⁻⁶, 5- 1×10⁻⁵, 6- 2.5×10⁻⁵, 7- 5×10⁻⁵). (a) and (b) correspond to D l =15nm and D l =60nm. Solid line and dash line correspond to 25ºC and 37ºC.
3.4 Effects of acyclovir on microstructure of
Hb
Figure 6 shows effects of acyclovir concentration on the secondary microstructure
parameters of Hb. With the increase of acyclovir concentration, the percents of the a
-helix, turn and random structures decrease but the percent
of the b -sheet increases. The association and interaction of acyclovir with Hb make Hb
structure change. When acyclovir concentration is much more than (5×10⁻⁶ mol
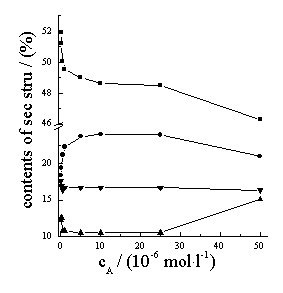
Figure 6 Effects of acyclovir concentration on the structure parameters of Hb. Hb concentration is 5×10⁻⁶ mol·L-1. ■a -Helix; ●b -sheet; ▲Turn; ▼Random
(a) (b) (c)
(d) (e)
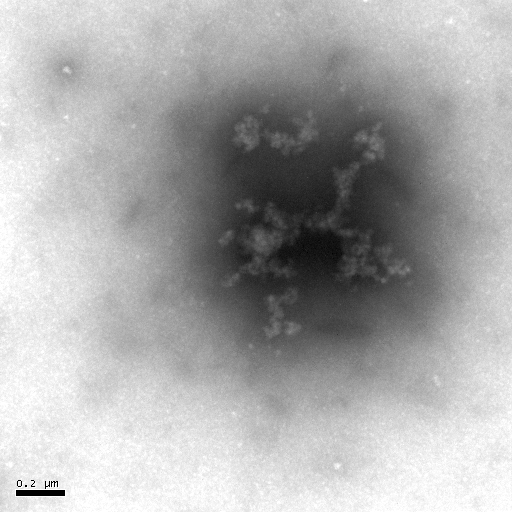
Figure 7 Negative-staining TEM of Hb. The concentration of Hb is 5×10⁻⁶ mol·L-1. The acyclovir concentrations change from 0 to 1×10⁻⁴ mol· L-1 [(a)- 0, (b)- 1×10⁻⁷, (c)- 1×10⁻⁶, (d)- 1×10⁻⁵, (e)- 1×10⁻⁴].
The negative-staining TEM of Hb can also illuminate that acyclovir causes the Hb structure to unfold and the morphology of Hb to loosen (Figure 7). When acyclovir concentration increases to 1×10⁻⁵ mol
·L-1, Hb is obviously denatured.3.4 Conclusion
Acyclovir affects the UV-vis and the fluorescence spectra, the electric properties and microstructure parameter of Hb. The association and interaction of acyclovir with Hb may restrict and affect the metabolism and distribution of acyclovir in human body and some drug efficacy. Acyclovir leads the behaviors of Hb or erythrocyte to change, which may be one of the reasons that the drug gives a premium on anaemia and other side-effects.
REFERENCES
[1] Insook Kim, Xueqin Song, Balvinder S. Vig, et al, Molecular Pharmaceutics, 2004,
1: 117.
[2] D Blisse Jain-Vakkalagadda, Dhananjay Pal, Sriram Gunda, Yasser Nashed, et al,
Molecular Pharmaceutics, 2004, 1:338.
[3] E Insook Kim, Gordon M. Crippen, Gordon L. Amidon, Molecular Pharmaceutics, 2004,
1:434.
[4] Tip W. Loo, M. Claire Bartlett, and David M. Clarke, Molecular Pharmaceutics, 2004, 1:
426.
[5] Venkita Subbulakshmi, Amiya K. Ghosh, Tanya Das, Biochemical and Biophysical Research
Communications, 1998, 250:15.
[6] Sandhya Verma, Sangeeta Patela, Ramandeep Kaur, et al, Biochemical and Biophysical
Research Communications, 2005, 326: 290.
[7] Jaya Bhattacharyya, Maitree Bhattacharyya, Abhay Sankar Chakraborti, ea al,
International Journal of Biological Macromolecules, 1998, 23: 11.
[8] Jonathan A. Lukin and Chien Ho, Chem. Rev., 2004, 104: 1219.
[9] Takeda, K.; Sasa, K.; Kawamoto, K.; Wada, A.; Aoki, K., J. Colloid Interface Sci.,
1988, 124: 284.
[10] C.T. Andrade, L.A.M. Barros, M.C.P. Lima, E.G. Azero, International Journal of
Biological Macromolecules, 2004, 34: 233.
[11] Sanna Tolle-Sander, Kimberley A. Lentz, et al, Molecular Pharmaceutics, 2004, 1: 40
[12] Nehal A. Kasim, Marc Whitehouse, Chandrasekharan Ramachandran, et al, Molecular
Pharmaceutics, 2004, 1: 85.
[13] Ying Lixing, Li Heming, Clinical Medicine of China, 2003, 19: 486.
[14] Juan M. Ruso, Pablo Taboada, Pablo Martnez-Landeira, et al, J. Phys. Chem. B, 2001,
105: 2644.
[15] Elva C.O' Sullivan, Anthony J.I. Ward, Langmuir,
1994, 10: 2985.
[16] Bidisa Sengupta, Jan Swenson, Biochemical and Biophysical Research Communications,
2005, 334: 954.
[17] Apurba Kumar Sau, Douglas Currell, Shyamalava Mazumdar, Biophysical Chemistry, 2002,
98: 267.
[18] Lakowicz, J. R., Principles of Fluorescence Spectroscopy, New York: Plenum Press,
1983, 264.
[19] Joseph R. Lakowicz and Gregorio Weber, Biochemistry, 1973, 21: 4161.
[20] Cheng Weisheng, Li Wei, JiangYoungming, Protein Molecular Foundation, Beijing: Higher
Education Press, 1995, 235-260.
[21] Yang Manman, et al, Chinese Science Bulletin, 1994, 39: 31.
[22] Fan Meisong, et al, Photochemistry Basic Principle and photon Material Science,
Beijing: Science Press, 2001, 82.
[23] Zhou Xianwang, Hu Xiaoqing, Instrument Analyse and Experiment Technology in
biochemistry, Beijing: Chemical Engineering Press, 2003, 36.
[24] Shang Zicai, Yi Pingcui, Yu Qingsen, Lin Ruisen, Acta Phys. Chim, Sin., 2001, 17: 48.
[25] Satoshi Toyoshima, Minoru Fukuda, Toshiaki Osawa, 1972, 10: 4000.
阿昔洛韦药物对血红蛋白性质的影响
刘天晴a,b 郭荣 b
(a
摘要 采用紫外-可见光谱法、荧光光谱、高效液相色谱、电化学方法和蛋白质负染-电镜等方法研究了药物阿昔洛韦对血红蛋白性质的影响。结果表明:阿昔洛韦能与血红蛋白结合形成一新的复合物,结合常数和结合数分别为7.6×10⁴ l·mol-1和1.25。阿昔洛韦能猝灭血红蛋白的荧光,其猝灭过程的半衰期为8.8分钟。在阿昔洛韦浓度较高时,阿昔洛韦猝灭血红蛋白过程既有静态猝灭,也有动态猝灭。
关键词 血红蛋白,阿昔洛韦,影响,性质