http://www.chemistrymag.org/cji/2008/109045pe.htm |
Sep.
1, 2008 Vol.10 No.9 P.45 Copyright |
Atomic force microscopic investigations on pectin gelling made under optimum conditions
Li Yan1, Wu Yue2, Cai Jiye1
( Department of Chemistry, Jinan University, Guangzhou 510632, China; 2
Department of Biomedical Engineering, Jinan University, Guangzhou 510632, China)
Abstract The optimum conditions for
pectin gelling was determined by investigating the effect of the concentrations of
ethanol, pectin and pH. Atomic force microscopy (AFM) was employed to observe pectin gels
made under such conditions immediately and four months later. Monofactor analysis and
analysis of interactive effect show that the gelling effects of pectin vary with different
concentrations of ethanol, pectin and different pH values and the best effect can be
obtained when ethanol was added to the 1% pectin solution with pH 1.0 until the
concentration of ethanol reaches 85%. AFM immediate images of pectin gels made under such
conditions demonstrate large pore sizes on a micrometer level, which have the potential of
being used as new scaffolds for tissue engineering, vehicles for sustained drug delivery
as well as substances for reducing cholesterol. However, four months later, only several
low peaks remained, indicating the decomposition of gels.
Keywords high-methoxyl pectin, gel, pH, concentrations of ethanol, atomic force
microscopy (AFM)
1. INTRODUCTION
Pectin is a family of heterogeneous branched polysaccharides with some common features but
different structures rather than a molecule, which is rich in the cell walls of all higher
plants. Each pectin molecule varies regarding to its chemical structure and molecular
weight. The structure of pectin is mainly composed of two sections: homogalacturonan (HG)
which is called "smooth region" and
rhammogalacturonan (RG) known as "hairy region". The dominant structure of
pectin is a linear chain formed by a-(1→4)-linked D-galacturonic
acids (
Scheme 1 Basic structure of pectin showing that some of the carboxyl groups are esterfied. The method of ethanol precipitation is commonly applied during the process of pectin extraction [4] and some technique conditions such as pH, ethanol, etc. should be controlled. It has been reported that the effect of pectin extraction is also influenced by pH of the precipitating solution [5-7].
The gelling characteristics of pectin were first discovered in 1825 by Hennri Braconnot and then widely used in the food industry. Recently, the application of pectin gel extends to the field of drug release. It is very promising that pectin is used as drug carriers for oral drug delivery based on its gelling characteristics [8-12].
Atomic force microscopy (AFM), a powerful new tool for studying biopolymers, has evident advantages for detecting the surface properties of a sample. Through using AFM, it is possible to study the characterization of the heterogeneity of a molecular population at the level of single polymers, for it can resolve single molecules so that differences in size and conformation between neighboring polymers can be visualized directly [13]. Our laboratory has successfully used AFM to study the characterization of polyelectrolyte complex films of hyaluronic acid/chitosan [14] as well as the intermediate stages of fibronectin fibrillogenesis within fibrils [15], showing that AFM plays an important role in investigating the topography and roughness of the sample. In addition, AFM can also provide some information about the mechanical properties. Experiments by Toshio Nishi et al. [16] demonstrated that Young's modulus mapping can be obtained with nanometer scale resolution. AFM is also used for the studies of polymer crystallization by some investigators [17-19].
AFM provides an opportunity to image and measure individual, intact pectin polymers and there are some investigations on the conformation and structure of pectin from various plants by employing AFM [13,20-25]. For example, Victor J. Morris et al. [21-24] conducted a series of researches by using AFM to image the structure of pectin molecules isolated from unripe tomato. In their recent study [24], they found through AFM that a main portion of unaggregated pectin molecules extracted from unriped tomato cell walls consist of pectin-protein complexes, which do not contain branched pectin chains. Nevertheless, few use AFM to detect the characterization of pectin gels.
In this study, we determined the optimum conditions for the HM pectin gelation and employed atomic force microscopy of the pectin gels that are formed under such conditions above. In the first step, we investigated the effect of some factors including pH of the solution, pectin and ethanol concentrations on the HM pectin gelation. In the second, we performed the roughness and linear measures for gels made under optimum conditions through the software supplied by AFM manufacturer. It is likely that such gels can be used as new scaffolds for tissue engineering and also in the field of drug delivery.
2. EXPERIMENTAL
2.1 Materials
HM pectin powder was purchased from Sigma (P9135) and dissolved by tridistilled water.
2.2 Monofactor analysis
Three groups were set. In the first group, the pH of the solution was stabilized to 3.0 at
room temperature. Ethanol was added to the 1% pectin solutions until the concentration of
the ethanol reached 70%, 75%, 80%, 85%, 90% and 95%, respectively. The ratio of the volume
of remaining liquid to the original volume of liquid was measured after an hour in order
to analyze the effects of different concentrations of ethanol on the pectin gelation.
The second group is to analyze the effect of different
concentrations of pectin on the gelation. At room temperature, the pH of the solution was
also stabilized to 3.0. Ethanol was added to the pectin solutions with different
concentrations of pectin (0.01%, 0.02%, 0.05%, 0.1%, 0.2%, 0.5%, 1%, 2% and 5%,
respectively) until the concentration of ethanol reached 80%. The ratio of the volume of
remaining liquid to the original volume of liquid was then measured after an hour so that
the gelling effects can be determined.
In the third group, the effect of pH of the pectin solution on the
gelation was discussed. Also at room temperature, ethanol was added to the 0.1% pectin
solutions with different pH values (pH 0.0, 0.5, 1.0, 1.5, 2.0, 2.5, 3.0, 3.5, 4.0 and
4.5, respectively) until the concentration of ethanol reached 80%. After an hour, the
ratio of the volume of remaining liquid to the original volume of liquid was measured.
2.3 The analysis of interactive effect
According to the results from monofactor analysis, ethanol was added to 0.5% and 0.5
pectin solutions with different pH values including 0.5, 1 and 1.5 until the concentration
of ethanol reached 75%, 80% and 85% respectively (Table 1). The gelling effects were
analyzed after an hour through the method mentioned above and hence the optimum conditions
including pH of the solution as well as the concentration of pectin and ethanol can be
determined.
Table 1 Add ethanol to 0.5% and 0.5 pectin solutions with various pH values
including 0.5, 1 and 1.5 until the concentration of ethanol reached 75%, 80% and 85%
respectively
No. |
Concentrations of Ethanol(%) |
Concentrations of Pectin(%) |
pH |
1 |
75 |
0.5 |
0.5 |
2 |
75 |
0.5 |
1.0 |
3 |
75 |
0.5 |
1.5 |
4 |
75 |
1.0 |
0.5 |
5 |
75 |
1.0 |
1.0 |
6 |
75 |
1.0 |
1.5 |
7 |
80 |
0.5 |
0.5 |
8 |
80 |
0.5 |
1.0 |
9 |
80 |
0.5 |
1.5 |
10 |
80 |
1.0 |
0.5 |
11 |
80 |
1.0 |
1.0 |
12 |
80 |
1.0 |
1.5 |
13 |
85 |
0.5 |
0.5 |
14 |
85 |
0.5 |
1.0 |
15 |
85 |
0.5 |
1.5 |
16 |
85 |
1.0 |
0.5 |
17 |
85 |
1.0 |
1.0 |
18 |
85 |
1.0 |
1.5 |
2.4 Atomic force microscopy of a pectin gel
under optimal conditions
The Autoprobe CP Research atomic force microscope used in this study was manufactured by
ThermoMicroscopes IncTM, Santa Barbara, CA. For imaging, the pectin gels made under
optimal conditions were placed on a clean glass slide. At room temperature and a relative
humidity of 70%, surface topographic images of gels were examined immediately with the
atomic force microscope and commercial silicon nitride (Si3N4) tips. Then pectin gels were
observed again through AFM four months later. The image processing as well as data
analysis including roughness and linear measurement were performed by the Proscan Image
Processing Software Version 2.1 supplied by AFM manufacturer.
3. RESULTS
3.1 Monofactor analysis
The first group demonstrates that when ethanol was added to the 1% pectin solution until the concentration of ethanol reaches 80% at pH 3.0, the ratio of the volume of remaining liquid to the original volume of liquid was the smallest and hence the gelling effect was the best (Fig. 1).
Fig. 1 The effect of the concentrations of ethanol on the gelling effects.
In the second group, as
for the same pH conditions as well as the same concentration of ethanol but different
concentrations of pectin, with the increase in the concentration of pectin ranging from
0.01% to 1% also came the gradual decrease in the ratio of the volume of remaining liquid
to the original volume of liquid, which reveals that gelling effects became better and
better (Fig. 2). It is estimated that when the concentrations of pectin rise to 2% and 5%,
the ability of gelling will increase accordingly. However, unfortunately, there were some
small deposits in the solution before the pectin was completely dissolved, indicating that
the nature of pectin may change. Thus, as for the same pH conditions as well as the same
concentration of ethanol, the ability of gelling is strongest when the concentration of
pectin is 1%.
Fig. 2 The effect of the concentrations of pectin on
the gelling effects.
The third group shows
the gelling effect is the best when pH of the solution is 1.5 and other conditions remain
the same, for the ratio of the volume of remaining liquid to the original volume of liquid
was smaller at pH 1.5 than that at other pH values (Fig. 3).
Fig. 3 The effect of pH values of the pectin solutions on gelling effects.
3.2 The analysis of interactive effect
Group 17 in Table 1 shows the best gelling effect; i.e. when ethanol was added to the
1% pectin solution with pH 1.0 until the concentration of ethanol reached 85%, the
remaining liquid in the container could not be measured by our current device, indicating
that the ratio of remaining liquid to the original volume of liquid was approximately 0.
Therefore, we can determine that the conditions in Group 17 are the optimum ones for
gelation.
3.3 Atomic force microscopy of a pectin gel made under optimal conditions
Fig. 4-5 shows the images of pectin gels that were examined immediately through AFM,
of which scan size is 20.0μm×20.0μm and 2.00
Fig. 6 demonstrates the AFM images of pectin gels that were examined four months later. The scan size is 20.0mm×20.0mm. According to Fig. 6, there is no pore and only several dispersed peaks remain. The mean height is 60.5nm, much lower than that of pectin gels that were examined immediately.
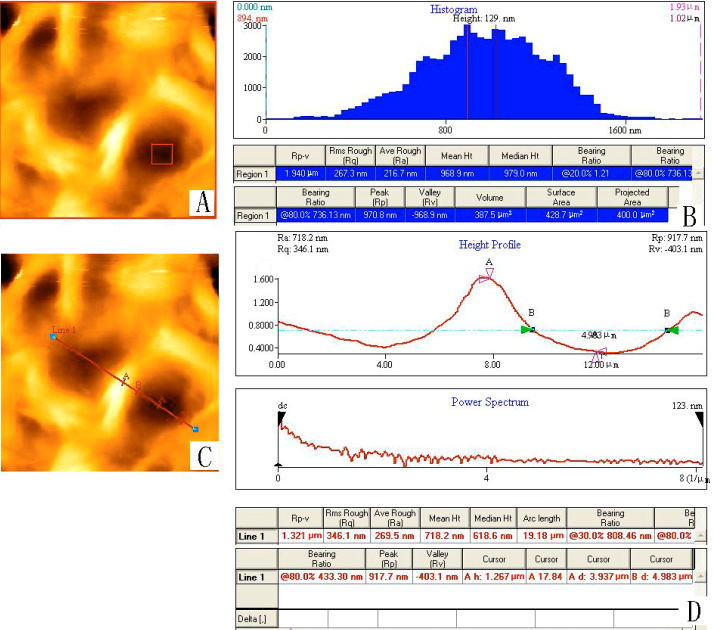
Fig. 4 Pectin gels were examined immediately through AFM with scan size 20.0mm×20.0mm. (A) 2-D Image of the pectin gels; (B) Height histogram of the pectin gels and some parameters including the average roughness value and mean height measured by the Proscan Image Processing Software Version 2.1; (C) 2-D Image of the pectin gels when a line across two pores is employed; (D) Diameter as well as some other parameters of the pores that the line crosses.
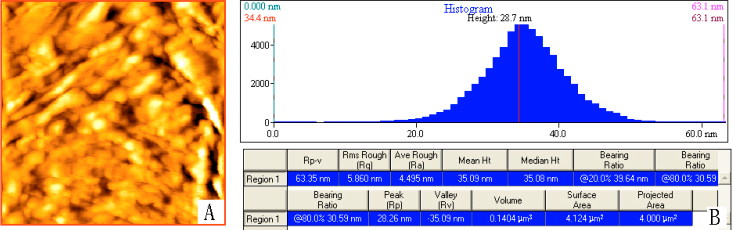
Fig. 5 Pectin gels were examined immediately through
AFM with scan size 2.00mm×2.00mm. (A) 2-D Image of the pectin gels; (B) Height histogram of the
pectin gels and some parameters including the average roughness value measured by the
Proscan Image Processing Software Version 2.1.
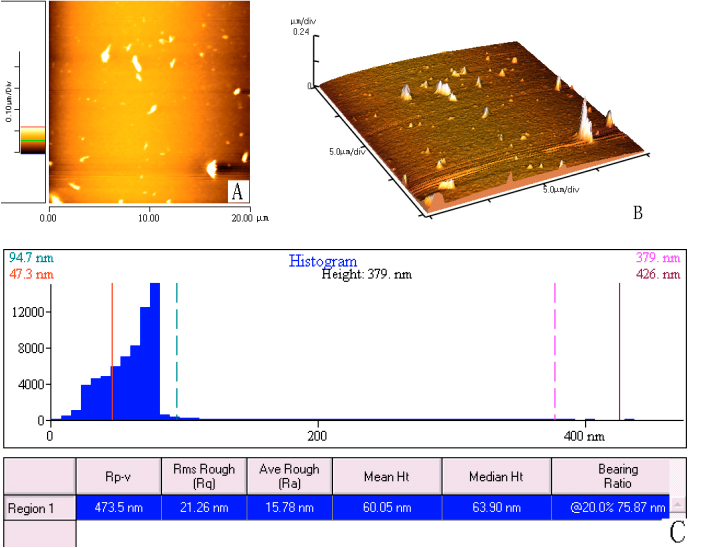
Fig. 6 Pectin gels were examined after four months through AFM with scan size 2.00mm×2.00mm. (A) 2-D image of pectin
gels; (B) 3-D image of pectin gels that shows more clear that there are only several
dispersed peaks remained four months later; (C) Height histogram of pectin gels and some
parameters including average roughness and mean height measured by the Proscan Image
Processing Software Version 2.1.
4. DISCUSSION
A pectin gel can be formed when portions of HG are crossed-linked to form a three
dimensional crystalline network in which water and solutes are trapped. In HM pectin the
junction zones are formed by the cross-linking of HG by hydrogen bridges and hydrophobic
forces between methoxyl groups [26]. The junction zones are of limited size. If
they are too large, a precipitate will appear instead of a gel.
Pectin is soluble in pure water, but it is insoluble in aqueous
solutions which they can gel. The viscosity of a pectin solution depends on several
factors such as the concentration of pectin, molecular weight, degree of esterification
and the pH [27]. In general, the viscosity of a pectin solution rises with the
increase in the concentration of pectin although the relation between them is not always
linear. When the concentration of pectin in the solution is below 0.01%, the relation
between concentration and viscosity is almost linear, for under such a condition pectin in
the solution is highly ionized. The rising trend of the viscosity decreases as the
concentration of pectin is increased to 0.1% and whereas the trend increases again when
continuing rising the concentration [28]. Thus, the larger the concentration of
pectin is, the better the gelling effects become.
Two main factors prevent the gelation of pectin and influence gel
characteristics: (1) intermolecular electrostatic repulsion between the carboxylate
anions; (2) polymer-water interactions acting in competition with polymer-polymer
interactions [29]. The former barrier can be eliminated by reducing the number
of negative charges while the latter one can be overcome by partially replacing water with
another medium that has less capacity to form hydrogen bonds with the polymer chains.
Higher pH makes possible the saponification of ester leading to the
degradation of pectin. When the saponification occurs, intermolecular carboxyl groups have
negative charges responsible for the repulsion between the carboxylate anions. Thus,
sponification that results from high pH prevents pectin from gelling.
With the gradual drop in the pH also comes the steady decrease in the
repulsion force between intermolecular carboxyl groups, because the increase in the
concentration of H+ in the solution inhibits the ionization of carboxyl groups. Thus,
gelation of pectin occurs when pH value is lowered to the pKa of pectin. However, it can
be seen from the experiment that the effect of gelling is undermined when pH is much
smaller than the pKa of pectin. This may be due to the degradation of some pectin when the
concentration of H+ is too high.
The ethanol added to the pectin solution reduces the effect of the
second barrier mentioned above on the pectin gelation. Pectin molecules interact with
water forming strong hydrogen bond so that pectin can be dissolved in the water. The
ethanol can form less hydrogen bond with pectin, which reduces the solubility of pectin in
the water. In addition, the decrease in the hydrogen bond relatively increases the
interactions between pectin molecules and the polymer-polymer interactions rise, which
makes it possible for the pectin to deposit.
Our experiment also shows that the best gelling effects of pectin occur
when the concentration of ethanol is 80%~85% rather than 90% or higher. One possible
reason is that when adding too much ethanol, some ethanol or water or mixture of ethanol
and water may be outside the three dimensional crystalline network that portions of HG in
the pectin form by cross-linking. As a result, the best gelling effect cannot be achieved.
It is also likely that the bond length increases due to the weak hydrogen bond between the
pectin molecule and ethanol, leading to the decrease in the number of ethanol molecules in
the network with a specific size and hence the ability of gelling drops.
As for the atomic force microscopy of pectin gels, AFM images show that
pore sizes of gels are surprisingly large compared to the sizes of the complex films of
hyaluronic acid/chitosan in the previous research [16]. The great differences
between the average roughness values with scan size 20.0mm×20.0mm and 2.00mm×2.00mm also supports the
fact of the large pore sizes. As is mentioned above, the average roughness value with scan
size 20.0mm×20.0mm is much larger than
that with 2.00mm×2.00mm, indicating that there are a number of peaks and pores that make
the surface rough when scan size is 20.0mm×20.0mm and few peaks and pores when setting scan size to 2.00mm×2.00mm.
The large pore sizes should be ascribed to the swelling of gels. It has
been reported that gels swell more for turgescible gels when acid is added [30,31]
and Donnan effect plays an important role. As a well-known effect described in previous
works [32,33], Donnan effect is helpful to evaluate the distribution of simple
ions between surroundings and gels. If the colloid particles are electrically charged, the
colloid component must contain enough small ions to make it neutral. Most membranes are
permeable to small ions and both sides must remain electrically neutral [33].
In this study, Donnan effect produces an excess of ions within the gel compared to the
surroundings, triggering the gel swelling [34]. Donnan effect on the gel
swelling can be detailed in the following way. Excessive cations (H+) in the network
diffuse into the surroundings according to Donnan effect. The event of the diffusion of
the cations exert a pull on the anions forming the three dimensional crystalline network.
Therefore, the volume of the gels as well as the pore sizes increase greatly.
The time needed for gel swelling can be calculated by the equation
[35,36]
![]()
From the equation above, the
characteristic time of the swelling speed is related to the final radius ![]() and the diffusion coefficient of the gel D.
and the diffusion coefficient of the gel D.
In this study, ![]() = 100nm,
D=10-5~10-7cm2/s and hence t≈10-6~10-4s. The gel swelling occurs so fast that we cannot observe
and measure the process of it based on our current knowledge level.
= 100nm,
D=10-5~10-7cm2/s and hence t≈10-6~10-4s. The gel swelling occurs so fast that we cannot observe
and measure the process of it based on our current knowledge level.
According to its characteristic of self-degradation as well as
relatively large pores mentioned above, the pectin gel has the potential of being used as
a scaffold for tissue engineering. Although there are a lot of investigations on scaffolds
made by gels [37-39], none has reported such an application of pectin gels.
Further studies need to be carried on for the potential application of the pectin gel made
under the optimum conditions mentioned above as a new scaffold. It is also possible that
such gel can be employed in the field of sustained drug delivery [9] and used
to remove cholesteral in liqiud egg yolk [40].
After four months later, there are only several low peaks on the
surface, indicating the decomposition of gels. One possible reason contributing to this is
the autoxidation of pectin gels. H at a-COOH is oxidized to the endoperoxide moiety (Scheme 2), which then
activates the whole molecule so that further oxidation can occur more easily.
Scheme 2 The possible process of the autoxidation of
pectin gels.
5. CONCLUSIONS
In this study, we use the monofactor analysis and the analysis of interactive effect
to determine the optimum conditions for pectin gelling. When ethanol was added to the 1%
pectin solution with pH 1.0 until the concentration of ethanol reaches 85%, the ratio of
remaining liquid to the original volume of liquid was approximately 0, which indicated the
best gelling effects. In general, the repulsion force between intermolecular carboxyl
groups at low pH is very weak and the ethanol added to the pectin solution reduces the
effect of polymer-water interactions. Thus, gelation of pectin can occur.
Pores on a micrometer level are observed when examining pectin gels
made under optimum conditions through AFM immediately, which is also supported by the fact
that the average roughness value with scan size 20.0mm×20.0mm is much larger than that with 2.00mm×2.00mm. Such phenomenon should be due to the swelling of the gels. AFM
images of the gels were performed again after four months and no pores can be observed,
only remaining several low dispersed peaks, showing that the gels were decomposed.
Acknowledgements This work was financially supported by the National Natural Science Foundation of China (No. 60578025) and International Cooperation and Exchange Program by National Natural Science Foundation of China (No. 30540420311).
REFERENCES
[1] Monge M E., Negri R M., Kolender A A., et al. Rapid Communications in Mass
Spectrometry, 2007, 21 (16): 2638-2646
[2] Baets S., De Vandamme E J., Steinbuchel A. Biopolymers Volume 6: Polysaccharides II:
Polysaccharides from Eukaryotes. Weinheim: WILEY-VCH, 2003: 311-312
[3] Lofgren C., Hermansson A M. Food Hydrocolloids, 2007,
21 (3): 480-486
[4] Iglesias M T., Lozano J E. Journal of Food Engineering, 2004, 62 (3): 215-223
[5] Mollea C., Chiampo F., Conti R. Food Chemistry, 2008, 107 (3): 1353-1356
[6] Sahari M A., Akbarian A., Hamedi M. Food Chemistry, 2003, 83 (1): 43-47
[7] Kalapathy U., Proctor A. Food Chemistry, 2001,
73 (4): 393-396
[8] Sriamornsak P., Puttipipatkhachorn S. Marcromolecular Symposia, 2004, 216: 17-21
[9] Itoh K., Kubo W., Fujiwara M., et al. International Journal of Pharmaceutics, 2006, 312 (1-2): 37-42
[10] Murata Y., Miyashita M., Kato M., et al. Advances in Polymer Technology, 2005, 24
(1): 46-50
[11] Yapo B M., Robert C., Etienne I., et al. Food Chemistry, 2007, 100 (4): 1356-1364
[12] Joye D D., Luzio G A. Carbohydrate Polymers, 2000, 43 (4): 337-342
[13] Sriamornsak P., Thirawong N., Nunthanid J., et al. Carbohydrate Polymers, 2008, 71
(2): 324-329
[14] Feng Q., Zeng G C., Yang P H., et al. Colloids and Surfaces A: Physicochemical and
Engineering Aspects, 2005, 257-258 (special issue):
85-88
[15] Chen Y., Wu Y Z., Cai J Y. Biochemical and Biophysical Research Communications, 2007, 361 (2): 391-397
[16] Nishi T., Nukaga H., Fujinami S., et al. Chinese Journal of Polymer Science, 2007, 25
(1): 35-41
[17] Hobbs J K. Chinese Journal of Polymer Science, 2003, 21 (2): 135-140
[18] Kong X M., He S G., Wang Z., et al. Acta Polymerica Sinica, 2003, (4): 571-576
[19] Tan H S., Xie K., Liu W H., et al. Acta Polymerica Sinica, 2006, (9): 1106-1110
[20] Yang H S., Feng G P., An H J., et al. Food Chemistry, 2006, 94 (2): 179-192
[21] Round A N., MacDougall A J., Ring S G., et al. Carbohydrate Research, 1997, 303 (3):
251-253
[22] Morris V J., Gunning A P., Kirby A R., et al. International Journal of Biological
Macromolecules, 1997, 21: 61-66
[23] Round A N., Rigby N M., MacDougall A J., et al. Carbohydrate Research, 2001, 331 (3):
337-342
[24] Kirby A R., MacDougall A J., Morris V J. Carbohydrate Polymers, 2008, 71 (4): 640-647
[25] Itoh K., Hirayama T., Takahashi A., et al. International Journal of Pharmaceutics, 2007, 335 (1-2): 90-96
[26] Willats W G T., Knox P., Mikkelsen J D. Trends in Food Science & Technology,
2006, 17 (3): 97-104
[27] Marshall L F., Joseph J J. Chemistry and Function of Pectins. Washington DC: American
Chemical Society, 1986, 7
[28] Wu D R. Biochemistry of Carbohydrates (Tang Shengwu Huaxue). Beijing: Advanced
Education Press, 1987, 430-431
[29] Evageliou V., Richardson R K., Morris E R. Carbohydrate Polymers, 2000, 42 (3): 246-259
[30] Alexander J. Colloid chemistry theoretical and applied v 2 biology and medicine. New
York: Chemical Catalog Company, 1928, 410-411
[31] Paula H C B., Gomes F J S., de Paula R C M. Carbohydrate Polymers, 2002, 48 (3):
313-318
[32] Hiemenz P C. Principles of colloid and surface chemistry. New York: Marcel Dekker
Inc, 1977, 145-147
[33] Scatchard G. Equilibrium in solutions: surface and colloid chemistry. Cambridge
Massachusetts: Harvard University Press, 1976, 253-254
[34] Tibbits C W., MacDougall A J., Ring S G. Carbohydrate Research, 1998, 310: 101-107
[35] Gu X R., Zhu Y P. Gel Chemistry (Ningjiao Huaxue). Beijing: Chemical Industry Press,
2005, 46-49
[36] Tanaka T, Fillmore D J. Journal of Chemical Physics, 1979, 70: 1214-1218
[37] Lee J., Jallo G I., Penno M B., et al. Toxicology and Applied Pharmacology, 2006, 215 (1): 64-70
[38] Ramay H R., Zhang M Q. Biomaterials, 2003, 24
(19): 3293-3302
[39] Jockenhoevel S., Zund G., Hoerstrup S P., et al. European Journal of Cardio-Thoracic
Surgery, 2001, 19 (4): 424-430
[40] Rojas E E G., Coimbra J S D., Minim L A., et al. Carbohydrate Polymers, 2007, 69 (1): 72-78
李彦1,吴越2,蔡继业1
(1暨南大学化学系,广州 510632;2暨南大学生物医学工程系,广州 510632)
摘要 本文通过研究高甲氧基果胶凝胶过程中的影响因素(乙醇浓度、果胶浓度、溶液pH)确定了果胶的最佳凝胶条件,并使用原子力显微镜(AFM)对在该条件下制得的果胶凝胶分别在当时和四个月后进行观察。单因子分析和交互效应的影响分析等方法证实,对于不同的乙醇浓度、果胶浓度和pH条件,果胶的凝胶化效果也不相同。原子力显微镜对在最佳凝胶条件下制得的果胶的即时观察结果显示该凝胶具有较大的孔洞,因此可以被用作组织工程的支架材料以及缓释材料的载体等。但是,在四个月后再次使用原子力显微镜观察时,视场中仅显示只有几个残余的碎片,表明凝胶已经被降解。
关键词 高甲氧基果胶,凝胶,pH,乙醇浓度,原子力显微镜(AFM)