http://www.chemistrymag.org/cji/2000/022009ne.htm |
Feb.25,
2000 Vol.2 No.2 P.9 Copyright |
Spectrophotometric Determination of Proteins by Chromotrope 2R
Hu Qiuluan*, Zhao Fenglin, Li Kean
(College of Chemistry, Peking University, Beijing 100871; *Department
of Chemistry, Luoyang Teacher's College, China)
Received Nov. 24, 1999; Supported by the National Natural Science Foundation of China. (Grant No. 29392601)
Abstract Chromotrope 2R
can react with proteins to form complexes in Britton-Robinson buffer at pH 2.7 and room
temperature, which gives maximum absorption speak at 567nm with 65 nm of red shift
compared to that of Chromotrope 2R itself. The molar absorptivity of the BSA- Chromotrope
2R complex is 2.99×10⁵ L·mol-1·cm-1 and the linear
ranges for proteins determination are 0-100 mg/ml. The standard curves are obtained under optimum conditions in
our lab. The method is sensitive, accurate, and tolerant to many foreign substances,
moreover, all the reagents used are stable under the comditions and it is easy to perform.
Keywords Chromotrope 2R,Proteins,Spectrophotometry
1. INTRODUCTION
Dye binding protein assays are commonly used in biochemical and clinical
laboratories[1-5], and the reaction mechanism is still under investigation [6,7].
In this paper, the interaction befween Chromotrope 2R (the structure is below) and
proteins was reported. A new quantitative determination method for proteins has been
developed. Because the difference of maximum absorption wavelengths between Chromotrope 2R
and Chromotrope 2R-protein complexes (contrast l) achieves 65 nm, trace amount of protein can be determined with
good reproducibility and high sensitivity. The reagent Chromotrope 2R could not be
adsorbed on the wall of glass containers, so that this method is better than Coomassie
Brilliant Blue Assay[1] and easy to carry out. The effects of ion strength to
the staining reaction were studied. The amount of total proteins in a human serum sample
is determined with satisfactory results.
Chromotrope 2R
2. EXPERIMENTAL
2.1 Apparatus
A Shimadzu Model UV-265 double –beam
spectrophotometer (kyoto, Japan) was used for recording the absorption spectra, and a
Model 722 spectrophotometer (Shanghai, China) for the measurement of absorbance at a given
wavelength. Model 821 pH meter (Zhongshan University, China) was used in defermine pH
values.
2.2 Reagents
Proteins: bovine serum albumin (BSA), human serum albumin (HSA), human hemoglobin
(Hb), human g-globin (g-G), lysozyme (Lyso),a-Chymotrypsin (Chy), Egg albumin (OVA)
are purchaned from Sigma. The stock protein solutions were 1.00 mg/ml or 2.00 mg/ml.
Analytical-reagent grade chromotrope 2R, was obtained from Shanghai
Chemical plant (China) and the 5.00×10⁻⁴ mol/L aqueous solution was used for
working solution. Britton-Robinson buffer solution (B-R) was used to control pH values of
the tested solutions. All other reagents were analytical or guarantee reagent grade.
Doubly-deionized water was used throughout.
2.3 Procedure
In most experiments, To 10 ml volumetric flasks were added 4.00 ml of Chromotrope
2R (5.00×10⁻⁴ mol/L), 1.5ml of B-R buffer solution (pH 2.7) and certain amount
of protein standard solutions or samples, then diluted to the mark, and mixed thoroughly.
After laying aside for 20 min at room temperature, absorption spectra or absorbance of the
solution were measured at 567nm with 1cm cell against the reagents blank solution.
3. RESULTS AND DISCUSSION
3.1 Absorption spectra
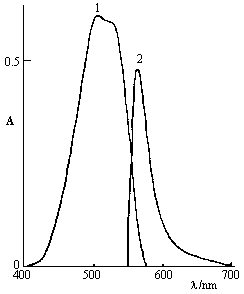
Fig.1 shows that, under the optimum experimental conditions, Chromotrope 2R is
pale red with maximum absorption at 501.6 nm, and the Chromotrope 2R-staining BSA is deep
red with an absorption peak at 567 nm (other proteins are also the same), the peak
wavelength was red shift 65nm. The 567nm is chosen as the determination wavelength for
Chromotrope 2R-staining protein, while Chromotrope 2R itself only has a absorption.
3.2 Effect of pH and buffer agents
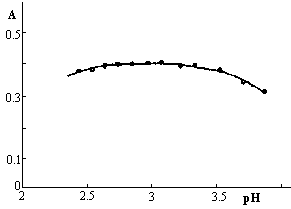
The absorbance of Chromotrope 2R-protein is affected by pH. At the range of pH
2.6~3.0, the absorbance
reaches maximum and the complexes are most stable, see Fig.2. Some buffer systems were
tested, the results indicated that, Britton-Robinson buffer and Clark-Lubs buffer are
better than others, 1.5 ml of B-R buffer (pH 2.7) was chosen to control pH of solutions.
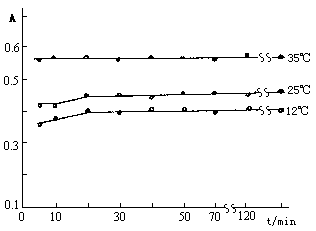
3.3 Effect of reaction time and temperature
Effect of reaction time was tested at 12°C(room temperature),25°C,35°C (water bath),
respectively. Results are showed in Fig.3. The interaction between Chromotrope 2R and BSA
occurs rapidly at the above mentioned temperatures (<20min), but sensitivity is not the
same. The higher the temperature, the higher sensitivity is. Room temperature and 20 min
were chosen for convenience and for the stable comtions of the complexes. The complex is
stable for at least 2hrs.
 |
 |
| Fig.1 Absorption spectra. 1. Chromotrope 2R 2. Cromotrope 2R-staining BSA c(Chromotrope 2R)=2.00×10⁻⁴ mol/L c(BSA)=1.47×10⁻⁶ mol/L; pH=2.7 |
Fig.2 Effect of pH
c(Chromotrope 2R) is 7.5×10⁻⁵ mol/L; c(BSA) is 2.94×10⁻⁶ mol/L |
 |
 |
| Fig. 3 Effect of time and
temperature c(Chromotrope 2R)=2.00×10⁻⁴ mol/L c(BSA)=1.47×10⁻⁶ mol/L; pH=2.7 |
Fig.4 Effect of the
concentration of Chromotrope 2R c(BSA)=1.47×10⁻⁶ mol/L; pH=2.7 |
3.4 Effect of Chromotrope 2R
concentration
The amount of Chromotrope 2R is tested for 1.47×10⁻⁶ mol/L BSA.
Experiments indicates that more than 3.5 ml of Chromotrope 2R is enough, see Fig.4. 4.0 ml
(final concentration of Chromotrope 2R is 2.00×10⁻⁴ mol/L) was taken for the
assay.
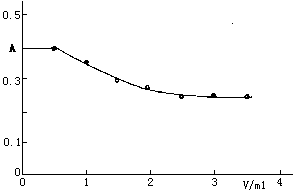
3.5 Effect of ion strength
The effect of ion strength on the reaction of Chromotrope 2R with BSA was tested
with NaC1. When the concentration of NaC1 was more than 0.005 mol/L, the absorbance of the
solution dropped became of the shielding effect of the ions.
 |
 |
| Fig.5 Effect of ion strength c(Chromotrope 2R)=2.00×10⁻⁴ mol/L; c(BSA)=1.47× 10⁻⁶ mol/L; pH=2.7 |
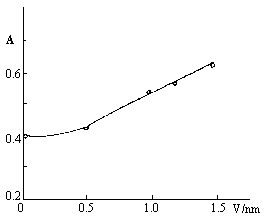
Fig.6 Effect of
surfactant CPB c(Chromotrope 2R)=2.00×10⁻⁴ mol/L; c(BSA)=1.47× 10⁻⁶ mol/L; pH=2.7 |
3.6 Effect of surfactants
Several kinds of surfactants were introduced to the reaction system of
Chromotrope 2R-protein, respectively. They are Neutral Triton X-100, OP and anion
surfactant SDS, which made the absorbance reduced. On the contrary, cation surfactant CPB
made the absorbance increased. When the concentration of CPB achieved 0.002%, the
absorbace increased about 33%(Fig.6). The results indicate that the complex between
Chromotrope 2R and BSA was formed mainly because of the electrostatic attraction.
3.7 Calibration curves
Calibration curves, linear range, apparent molar absorptivity (e) and sandell's sensitivity (S) of BSA,
HSA, Hb, g-G, Lyso, OVA and
Chy were obtained under the conditions given above. All the analytical parameters are
listed in table 1. Their sensitivities have some differences because of the difference
numbers of amino group in different proteins, in addition, the binding way of amino groups
to protein are not identical. Any dye-binding method could not overcome this problem up to
now.
Table 1. Parameters for proteins determination (n = 9)
|
||||||||||||||||||||||||||||||||||||||||||
|
3.8 Effects of coexisting
substances
The influence of coexisting substances, such as amino acids, metal ions, were
tested. The results are presented in table 2. There are twenty categories basic amino
acids in human body. We tested some typical amino acids, which existes more in human
serum. Experiment indicated that all of them almost do not interfere with the assay.
Table 2. Effects of coexisting substances (mg/ml)
|
||||||||||||||||||||||||||||||||||||||||||
|
3.9 Application on human serum
assay
Human serum sample was obtained from the Hospital of Peking University and was
diluted to about 1 mg/ml.
Transfer suitable amount of sample solution was transfered to 10 ml
volumetric flask and the determine total proteins was defermened by the above procedure
and classical method[1], respectively. The results are listed in table 3. The
standard deviation of the present method (0.36) is less than that of CBB G-250 method
(1.66). The recovery is satisfactory.
Table 3. Assay results of total proteins in human serum sample (n =3)
|
||||||||
|
REFERENCES
[1] Bradford M M. Anal. Biochem., 1976, 72: 248.
[2] Flores R. Anal. Biochem. 1978, 88: 605.
[3] Racusend. Anal. Biochem. 1973, 52: 96.
[4] Zhu K. Tong S Y. Chinese Journal of Chemistry, 1996, 54: 620.
[5] Li N, Tong S Y. Talanta, 1994, 41: 1657.
[6] Wei Y J, Li K A, Tong S N. Talanta, 1997, 44: 923.
[7] Cheng Z H, Li K A, Tong S Y. Analytical Chimica Acta, 1997, 345: 235.