http://www.chemistrymag.org/cji/2001/03a050ne.htm |
Oct. 1,
2001 Vol.3 No.10 P.50 Copyright |
Li Jiashen, Sheng Jing, He Fei, Ding
Huili
(Department of Material Science and Engineering, Tianjin University, Tianjin 300072,
China)
Received Apr. 3, 2001; Sponsored by National Natural Science Foundation of China (No.59733070).
Abstract Polyethylene (PE) was
submitted to CO2, N2 and Air low temperature plasma. The chemical
composition of the modified polymers was investigated by X-ray photoelectron spectroscopy
(XPS). It was found that the surface of the modified polymers had some functional groups,
such as -CO-O, -C-O-, -CO-NH2, -C-NH, besides original bonds. These groups
may improve the soakage and adhesion of the polymers. There are some oxygen-containing
groups but little nitrogen-containing groups on the surface of PE without plasma
treatment. The amounts of oxygen and the nitrogen combined with the PE surface are heavily
affected by plasma conditions. N2 plasma has to work with CO2 or air
plasma to introduce more nitrogen-containing groups on the PE surface.
Key words Low temperature plasma XPS Surface modification Polyethylene
1. INTRODUCTION
The industrial use of polyethylene is always increasing, but taking into account its low
surface energy, this polymer requires modification before it can be applied in some
special fields[1, 2]. Several methods have been developed to modify polymer
surface for improved adhesion including mechanical treatments, wet-chemical treatments,
corona discharge, and glow discharge plasma[3-5]. Basic objectives of any such
treatment are to remove surface contamination, to roughen surface, and to increase surface
reactivity. With plasma, it is possible to selectively add different functional groups to
the polymer surface. The plasma treatment can also alter the polymer surface by changing
the surface roughness and possibly causing some crosslinking[6-8].
A plasma treatment is a way to introduce some functional groups on the
surface of polymer[9, 10]. Plasma is a mixture of electrons, ions, and
radicals. These species disappear in the processes of electron-positive ion recombination,
and the radical-radical recombination. The rate constants of these reactions are in an
order of 10-7cm3/s and 10-33cm3/s,
respectively. When these species bombard on the surface of polymers with high energy, some
chemical reactions happens[11-13].
In this work, polyethylene (PE) was submitted to CO2, N2
and Air low temperature plasma and the treated polymer surfaces were studied with x-ray
photoelectron spectroscopy (XPS).
2. EXPERIMENTAL
2.1 Materials
Polyethylene (PE) was obtained from Yanshan Petrochemical Company, Beijing, China.
It was washed prior to the surface modification experiments.
2.2 Plasma Reactor
A special reactor for the plasma treatment was used. The reactor consists of a columnar
stainless steel chamber (210mm diameter, 150mm height) with a vacuum gauge (M713) and a
vacuum system of a rotary pump (4L/s). In the stainless steel chamber, there is a sample
stage positioned at 0 to 50mm from the copper electrodes for the rf power input. The
vacuum system can depress a pressure in the reaction chamber to an order of 10Pa. The
schematic diagram of the reactor is shown in Figure 1.
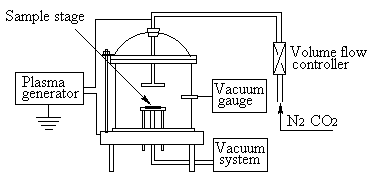
Fig. 1 Schematic representation of the
plasma reactor.
2.3 Plasma Treatment
PE grains were mounted on a given sample stage in the reaction chamber. The sample stage
was 20mm from the upper copper electrode. The reaction chamber was evacuated to
approximate 50Pa. Afterward, CO2 or N2 whose flow rate was adjusted
to 20cm3/min by a mass flow controller was introduced into the reaction
chamber. The plasma treatments were performed at a given radio frequency (rf) power of
100W for a given time of 120s. In order to compare with other plasma treatments, PS
and PE were treated in the reaction chamber without other gases.
2.4 X-ray Photoelectron Spectra
XPS spectra of the surface of the treated PE grains were obtained on a Perkin-Elmer
PHI1600ESCA System using a nonmonochromatic MgKα
X-ray source (1253.6 eV). The power was 250W and the background pressure in the analytical
chamber was 2.8×10⁻¹⁰Pa. A size of the X-ray spot was 2mm diameter, and a
take-off angle of photoelectrons was 90 degrees with respect to the sample surface. The
XPS spectra were referenced with respect to the 285.0eV carbon 1s level observed for
hydrocarbon to eliminate charge effects.
3 RESULTS AND DISCUSSION
Fig. 2, 3 and 4 were C1s, N1s and O1s spectra of PE
measured by XPS, respectively. From the results, we found that there were some O groups on
the surfaces after they were treated with the air, vacuum, CO2 and N2
plasmas. The quantities of O on the PE samples were 18.62%, 16.32%, 20.75% and 11.63%,
respectively. According to the bonding energy of C1s and N1s, we
know that the O groups were CO O and C O . There were two kinds of N groups, i.e.,
CO NH2 and C NH . The introducing of some polar groups on the PE surface can increase
the polarity of PE surface.
3.1 The influence of air plasma on PE surfaces
It can be seen form the XPS spectra (Fig. 5) that there are some O1s spectra
(no N1s spectrum) without any plasma treatments. In air, the ability of O2
to bond with polymer is stronger than that of N2. After treated with air
plasma, PE had both O and N spectrum (Table 1). Although the reaction chamber was
evacuated up to the pressure 50Pa, there was still air remained in it. In order to
investigate the influence of the residual air on the polymer surfaces, we treated PE
without importing any other gases. However, we surprisingly found that the content of N on
the PE surface was higher than that of the polymers treated by the air plasma.
Table 1 Summary of surface analysis for
plasma-modified PE
| Sample | EC1s/eV |
Carbon bond |
C1s |
O1s |
N1s |
|
1 |
Unmodified PE |
-285.06 |
C-C, C-H |
94.74 |
4.98 |
0.29 |
2 |
Air plasma- modified |
-285.06 |
C-C, C-H C-NH2, -C-NH- -CO-O-, -C-O- |
78.34 |
18.62 |
3.04 |
3 |
Vacuum plasma-modified |
78.02 |
16.32 |
5.66 |
||
4 |
CO2 plasma -modified |
72.60 |
20.75 |
6.65 |
||
5 |
N2 plasma- modified |
86.70 |
11.63 |
1.67 |
||
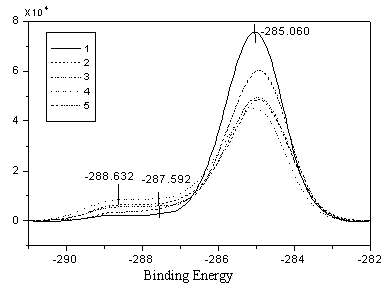
Fig. 2 C1s Spectra of PE measured by XPS
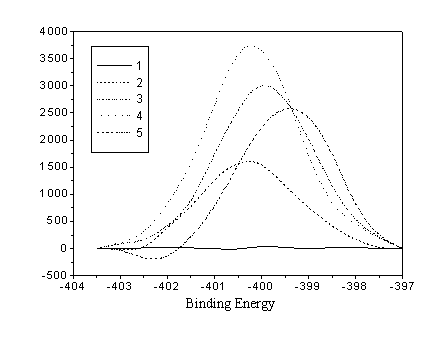
Fig. 3 N1s Spectra of PE measured by XPS
Fig. 4 O1s Spectra of PE measured by XPS
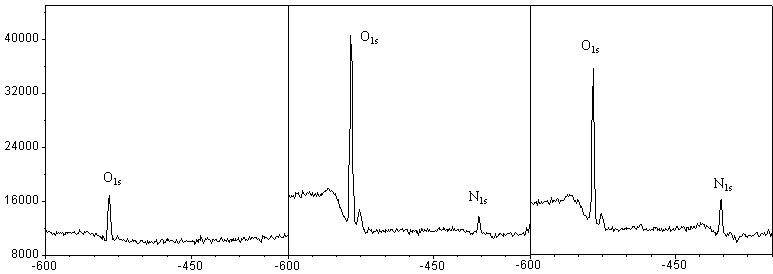
Fig. 5 The influence of air and air plasma on PE surface
(a) Unmodified (b) Air plasma-modified (c) Ample
air plasma-modified
3.2 The influence of CO2
plasma on PE surfaces
Contrast the result of CO2 plasma with the results of air plasma, we can find
that the value of O1s increased sharply and the value of N1s also got the max.
From the XPS spectrum, it was found that there was a peak for the carbonyl group (C=O) at
the 288Ev in the C1s spectrum (Fig. 2) and there was also a diagnostic peak for
the carbonyl group (C=O) at the 532Ev in the O1s (Fig. 3) spectrum. It
testified that there was some O that took part in the reactions. Paradoxically, there was
a N1s peak in the XPS spectrum, but, in fact, we did not introduce N2
into the reaction chamber. The only reason for this phenomenon is that the residual N2
took part in the reaction. There was also an interesting result that although there was
less N2 in the CO2 plasma than in the Air plasma, the area of N1s
peak in the CO2 plasma result is more than two times of that in the air plasma
result (from 3.04% to 6.65%). The reason maybe that the CO2 plasma induced the
excitation of N2 plasma. So the efficiency of excitation and reaction of N2
plasma was accelerated.
3.3 The influence of N2 plasma on PE surfaces
Compared with other plasmas, the N2 plasma can introduce less N and O groups on
the PE surface than other plasmas. In other words, the N2 plasma had a poor
ability to react with PE surface. It needs other plasmas to get a good effect.
REFERENCE
[1] Du M, Opila R L, Donnelly V M, et al.. J. Appl. Phys., 1999, 85(3): 1496-1502.
[2] Inagaki N, Tasaka S, Horiuchi T. J Appl Polym Sci., 1998, 68: 271-279.
[3]Mutel B, Gri,mblot J, Dessaux O, et al., Surf. Interface Anal. 2000, 30: 401-406.
[4] Chen-Yang Y W, Liao J D, Kau J Y. et al.. Macromolecules, 2000, 33: 5638-5643.
[5] Gupia B, Hilborn J, Hollenstein CH, et al.. J. Appl. Polym. Sci., 2000, 78: 1083-1091.
[6] Yang G H, Kang E T, Neoh K G. J. Polym. Sci.: Part A:
Polym. Chem., 2000, 38: 3498-3509.
[7] Yamada K, Ebihara T, Gondo T, et al.. J. Appl. Polym. Sci., 1996, 61,1899.
[8] Dayss E, Leps G, Meinhardt J. Surface and Coatings Technology. 1999, 116-119: 986-990.
[9] Bichler Ch, Kerbstadt T, Langowski H C, et al.. Surface and Coatings Technology. 1999,
112: 373-378.
[10] Zhang L, Mao K Y, Zhang X S. Chem J Chinese Universities, 1999, 20(10): 1605-1608.
[11] Inagaki N, Tasaka S, Kawai H. J Polym Chem Ed, 1995, 33: 2001~2011.
[12] Hopkins J, Badyal J P S. J Phys Chem, 1995, 99: 4261~4264.
[13] Chen J R. Chem J Chinese Universities, 1997, 18(3): 466-471.