http://www.chemistrymag.org/cji/2003/051009ne.htm |
Jan. 1, 2003 Vol.5 No.1 P.9 Copyright |
Computer simulation of conic-shaped patterns on fracture surfaces of polymers
Luo Wenbo, Yang Tingqing#
(Institute of
Fundamental Mechanics and Material Engineering, Xiangtan University, Xiangtan 411105,
China;#Department
of Mechanics, Huazhong University of Science and Technology, Wuhan 430074, China)
Received on Sep. 24, 2002; Support by the Natural Science Foundation of China (10172037)
Abstract Fracture surface morphology
analysis, using scanning electron microscopy (SEM), is one of important methods to study
the polymer fracture mechanism. There are several distinct patterns on fracture surfaces,
such as radial striations, regularly spaced 'rib' markings and conic-shaped patterns. The
conic-shaped pattern is the intersection locus of a moving planar crack front and a
radially growing circular craze or secondary crack front. In this paper, the effects of
the ratio of crack velocity to growing craze or secondary crack velocity on the shape of
intersection loci are discussed via computer simulations. It is shown that when the ratio
of crack velocity to craze or secondary crack velocity, ![]() , increases progressively, the fracture surface
pattern changes from a parabola or a prolate parabola to an ellipse and finally to an
approximate circle.
, increases progressively, the fracture surface
pattern changes from a parabola or a prolate parabola to an ellipse and finally to an
approximate circle.
Keywords Fracture surface morphology, SEM, crazing, computer simulations
1. INTRODUCTION
Polymer glasses are attractive materials for
many engineering applications, as they are low in density, have excellent mechanical
properties and are easily fabricated by processes such as injection molding, extrusion and
vacuum forming. Their stiffness and strength must satisfy the structural needs. Therefore
the failure theory of polymers attracts many researchers' attention. During the fracture process, a craze or shear
yielding zone usually forms at a crack tip[1]. The initiation, growth and
breakdown of crazes or shear yielding zones are thus central to understanding of the
fracture mechanics of polymer glasses. There are two main methods to study the process of
craze growth and craze breakdown. One is optical interferometry used to measure the size
and shape of single crack tip crazes in transparent polymers [2,3]. The results
of interferometric measurements are used in connection with fracture mechanics models and
mathematical or numerical methods for calculations of stress in the micro-region at the
crack tip and thus giving qualitative and quantitative descriptions of deformation and
fracture processes. The other is fractographic analysis of fracture surfaces, which is an
important and often used method to investigate the failure mode and damage-fracture
mechanism [4-12]. Fracture process of many glassy polymers is usually
associated with craze formation and governed by craze growth and breakdown. There are
several distinct patterns on fracture surfaces, such as radial striations, regularly
spaced 'rib' markings
and conic-shaped patterns, etc. They are related to distinct deformation and fracture
mechanisms. The conic-shaped pattern is thought to be the intersection locus of a moving
planar crack front and a growing circular craze or secondary crack front [1,9-11].
In this paper, the effects of the ratio of crack velocity to craze or secondary crack
velocity on the shape of intersection loci are discussed via computer simulations.
2. DISTINCT PATTERNS ON FRACTURE SURFACES OF
POLYMERS
For a slow moving crack/craze entity in
polymethyl methacrylate (PMMA), crack growth takes place by breakdown of the craze along
its midrib which leaves a relatively smooth fracture surface [13,14] and
dissipates relatively small amount of energy to create new surfaces. During the continuous
loading, the crack growth speeds up, and the fracture surfaces have regularly spaced 'rib' markings perpendicular to the direction of crack
growth [15,16], which appears to be related to a type of stick/slip propagation
due to either crack bifurcation or the effect of stress waves [15]. The
transition between these two distinct types of surface morphology can be very abrupt. For
some other materials such as polystyrene (PS), polycarbonate (PC),
acrylonitrile-butadiene- styrene (ABS) copolymer, polypropylene (PP), high-density
polyethylene (HDPE) and epoxy resin, there exist more features on their fracture surfaces [4-17].
Conic-shaped patterns [9-11,17] are often seen on the fracture surfaces when
relatively slow crack growth has taken place as shown in figure 1. For rapidly moving
cracks in these materials irregular 'mackerel' or 'patch' patterns are found on fracture surfaces [1,8,11,14].
Fig.1 Parabola patterns on tensile fracture surface: (a) the fracture surface of HDPE;(b) the fracture surface of epoxy resin; (c) higher magnification of the features in (b)
The conic-shaped
surface patterns are thought to be the intersection loci of the moving planar crack front
and growing circular crazes or secondary cracks, as illustrated schematically by figure 2.
The parallel lines represent the moving crack front and the concentric circles represent
the radially growing craze or secondary crack front. It can be seen in figure 2 that the
points of intersection in time sequence form a conic-shaped pattern, aligned with the bow
of the conic section pointing towards the moving crack. Craze or secondary crack initiates
at the focal point of the conic section. The initiation site, which is the location of
stress concentration due to material inhomogeneity (e.g. secondary particles), can be
clearly seen in figure 1(c). The number of conic-shaped patterns is dependent on the
degree of material inhomogeneity and the loading conditions. It has been shown that the
shape of conic section is dependent on the ratio of crack velocity to craze or secondary
crack velocity, ![]() .
.
Fig. 2 Sketch of the conic-shaped pattern
3. COMPUTER SIMULATION OF CONIC-SHAPED
PATTERNS
The computer simulation of conic-shaped
patterns on fracture surfaces is given below based on their formation mechanisms. In
methodology it means to solve a system of equations that describe the motion of the moving
fronts of main crack and crazes or secondary cracks. As shown in figure 2, the main crack
is supposed to propagate right with velocity of ![]() , and the craze or secondary crack advances
radially with velocity of
, and the craze or secondary crack advances
radially with velocity of ![]() . The hatched circle in figure 2 indicates the craze initiation site. The
radius of the craze or secondary crack front (represented by circle in figure 3) is
assumed to reach
. The hatched circle in figure 2 indicates the craze initiation site. The
radius of the craze or secondary crack front (represented by circle in figure 3) is
assumed to reach ![]() at the instant when the main crack front first meets the front of craze or secondary
crack, i.e. when the first left line is exactly the tangent line of the smallest circle as
shown in figure 2. By constructing a coordinate system with its origin at the craze
initiation site and the x axis parallel to the crack growth direction, we can give
the control equations for crack front growth and craze front advance as follows
at the instant when the main crack front first meets the front of craze or secondary
crack, i.e. when the first left line is exactly the tangent line of the smallest circle as
shown in figure 2. By constructing a coordinate system with its origin at the craze
initiation site and the x axis parallel to the crack growth direction, we can give
the control equations for crack front growth and craze front advance as follows
![]() for crack front
growth (1)
for crack front
growth (1)
![]() for craze front
advance (2)
for craze front
advance (2)
in which t is time. Substituting Eq.(1) into Eq.(2) yields
![]() (3)
(3)
Eq.(3) is the control equation for the intersection loci of the moving planar crack front
and growing circular crazes or secondary cracks. It has a conic form, but the specific
shape depends on the ratio of crack velocity to craze or secondary crack velocity, ![]() .
.
Fig. 3 Computer simulation of conic-shape patterns on fracture surfaces for
different ![]()
In figure 3 it is
shown the variation of the shape of the conic-shaped patterns. The simulated patterns are
limited in a rectangular area with size of ![]() . From figure 3, it can be seen that when the ratio,
. From figure 3, it can be seen that when the ratio, ![]() , increases
progressively, the fracture surface pattern changes from a parabola or a prolate parabola
to an ellipse and finally to an approximate circle.
, increases
progressively, the fracture surface pattern changes from a parabola or a prolate parabola
to an ellipse and finally to an approximate circle.
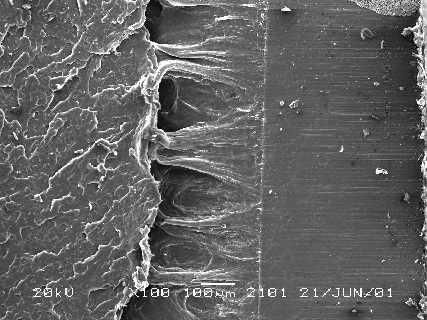
Figure 4 shows the fracture surface morphology near a crack root and
its simulation result for a dual edge notched PP specimen under tension with constant
displacement rate. In simulation we let r0=50mm,![]() =4/3. It can be seen
from figure 4(a) that several crazes form near the crack root due to stress concentration
and material inhomogeneity and they distribute in a regular spaced manner along the
specimen width. During the continuous loading, the crazes grow and simultaneously the
crack propagates slowly, their fronts intersect each other and form the parabola patterns.
When the instability criterion for crack growth is met, the crack propagates at a very
high speed and the crazes initiated near the crack front have no enough time to grow. Thus
a large number of fine near circle patterns are left on the fracture surface (see figure
5).
=4/3. It can be seen
from figure 4(a) that several crazes form near the crack root due to stress concentration
and material inhomogeneity and they distribute in a regular spaced manner along the
specimen width. During the continuous loading, the crazes grow and simultaneously the
crack propagates slowly, their fronts intersect each other and form the parabola patterns.
When the instability criterion for crack growth is met, the crack propagates at a very
high speed and the crazes initiated near the crack front have no enough time to grow. Thus
a large number of fine near circle patterns are left on the fracture surface (see figure
5).
 (a)
(a)  (b)
(b)
rapid crack slow crack
prefabricated
growth zone growth zone crack plane
Fig.4 (a) Parabolic patterns on fracture surface
of PP; (b)computer simulation
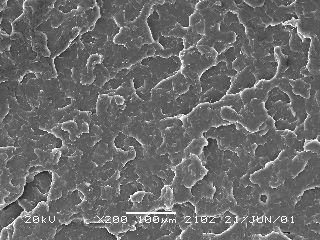
Fig.5 Surface patterns in rapid fracture region of PP specimen in Fig.4(a)
4. CONCLUDING REMARKS
Fracture surface morphology analysis is an
important method to investigate the failure modes and damage-fracture mechanisms of
polymers. The conic-shaped pattern is the intersection locus of a moving planar crack
front and a radially growing circular craze or secondary crack front. Its shape is
dependent on the ratio of crack velocity to craze or secondary crack velocity, ![]() . It is shown from the
computer simulations that when the ratio,
. It is shown from the
computer simulations that when the ratio, ![]() , increases progressively, the fracture surface pattern changes
from a parabola or a prolate parabola to an ellipse and finally to an approximate circle.
, increases progressively, the fracture surface pattern changes
from a parabola or a prolate parabola to an ellipse and finally to an approximate circle.
REFERENCES
[1] Kinloch A J, Young R J. Fracture Behaviour of Polymers, Applied Science
Publishers, London and New York, 1983.
[2] Doll W, Konczol L. In: Advances in Polymer Science, 91/92, (Ed. By Kausch H H),
Berlin: Springer, 1990, 137-214.
[3] Schirrer R. In: Advances in Polymer Science, 91/92, (Ed. By Kausch H H), Berlin:
Springer, 1990, 215-262 .
[4] Narisawa I, Ishkawa M. In: Advances in Polymer Science, 91/92, (Ed. By Kausch H H),
Berlin: Springer, 1990, 353-391.
[5] Li J X, Hiltner A, Baer E. J. Appl. Polym. Sci., 1994,52:269.
[6] Tanrattanakul V, Perkins WG, Massey FL. J. Mater. Sci., 1997,32:4749.
[7] Liu K, Piggott M R. Polym. Eng. Sci., 1998,38:69.
[8] Reynolds P T. J. Mater. Sci. Letters, 1988,7:759.
[9] Lee E K C, Rudin A. Plumtree A. J. Mater. Sci., 1995,30:209.
[10] Kulawansa D M, Langford S C, Dickinson J T. J. Mater. Res., 1992,7:129.
[11] Lu X C. Strength and failure of
polymeric materials (Gaojuwu De Qiangdu Yu Pohuai ), Chengdu: Sichuan Education Press
(Sichuan Jiaoyu Chubanshe),1988.
[12] Van Der Zwet M J M, Heidweiller A J. J. Appl. Polym. Sci., 1998,67:1473.
[13] Doyle M J. J. Mater. Sci., 1982,17:760.
[14] Lauterwasser B D, Kramer E J. Phil. Mag., 1979,A39:468.
[15] Kusy R P, Lee H B, Turner D T. J. Mater. Sci., 1976,11:118.
[16] Cheng Chihmin, Hiltner A, Baer E, et. al.. J. Appl. Polym. Sci., 1994,52:177.
[17] Zhang M J, Zhi F X, Su X R. Polym. Eng. Sci., 1989,29: 1142.