http://www.chemistrymag.org/cji/2003/056043pe.htm |
Jun. 1, 2003 Vol.5 No.6 P.43 Copyright |
Liu Minying,
Gao Lijun, Zhao Qingxiang, Wang Yudong, Yang Xiaojuan, Cao Shaokui
(College of Materials Engineering, Zhengzhou University, Zhengzhou 450052, China)
Keywords poly(dodecamethyleneisophthalamide), PA12I, degradation process, degradation kinetics
1 INTRODUCTION
The study of the thermal degradation of a polymer is of major interest since it can, in
many cases, determine the upper temperature limit of use for a material. Also,
considerable attention has been directed towards the exploitation of thermogravimetric
data for the determination of kinetic parameters. For this purpose, the thermogravimetric
analysis (TGA) is a technique widely used because of its simplicity and the information
afforded by a simple thermogram.
Many of the methods of kinetic analysis are based on the hypothesis
that, from a simple thermogravimetric trace, meaningful values may be obtained for
parameters such as activation energy and pre-exponential factor. There are many proposed
methods to calculate kinetic parameters and these reported values depend not only on
experimental conditions but also on mathematical treatment of data.
Poly(dodecamethyleneisophthalamide)(PA12I) is a semiaromatic, amorphous and transparent
polyamide. In this paper, we studied its thermal degradation process and mechanism of a
solid state process.
All kinetic information can be extracted from dynamic experiments by means of various methods. All kinetic studies assume that the isothermal rate of conversion , da/dt, is a linear function of a temperature-dependent rate constant, k, and a temperature-independent function of the conversion, a, that is:
that expresses the rate of conversion , da/dt, at a constant temperature(T) as a function of the reactant concentration loss and rate constant.
According to Arrhenius equation
where A, the pre-exponential factor , is assumed to be independent of temperature, Ea is the activation energy, T the absolute temperature, and R the gas constant.
Combination of Eqs. (1) and (2) gives
In the case of polymer degradation, it is assumed that the rates of conversion is proportional to the concentration of material that has to react,
f(a)=(1-a)n (4)
If the sample temperature is changed by a controlled and constant heating rate, b=dT/dt, the variation in the degree of conversion can be analysed as a function of temperature, this temperature being dependent on the time of heating.
This is the fundamental expression of analytical methods to calculate kinetic parameters on the basis of TG data. These methods can be distinguished as based on degree of conversion measurement. a, and based on heating rate b.
The variation in the degree of conversion can be analysed as a function of temperature, this temperature being dependent on the time of heating. Therefore, the rate of conversion may be written as follows:
A combination of Eqs. (3) and (7) leads to
![]() (8)
(8)
integration of this equation from an initial temperature, T0,
corresponding to a degree of conversion a0,to the
inflection temperature, Tp, where
if T0 is low, it may be reasonably assumed that a0=0 and considering that there is no reaction between 0 and T0[1]:
where
In the case of polymers, the degradation process follows either a sigmoidal function or a deceleration function. Table 1 shows different expressions of
Symbol |
g( a) |
Solid state processes |
Sigmoidal curves |
||
A2 |
[-ln(1- a)]1/2 |
Nucleation and growth(Avrami equation 1) |
A3 |
[-ln(1- a)]1/3 |
Nucleation and growth(Avrami equation 2) |
A4 |
[-ln(1- a)]1/4 |
Nucleation and growth(Avrami equation 3) |
Deceleration curves |
||
R1 |
a | Phase boundary controlled reaction (One-dimensional movement) |
R2 |
[1-(1- a)1/2] |
Phase boundary controlled reaction(contraction area) |
R3 |
[1-(1- a)1/3] |
Phase boundary controlled reaction(contraction volume) |
D1 |
a2 | One-dimensional diffusion |
D2 |
(1- a)ln(1-a)+ a |
two-dimensional diffusion |
D3 |
[1-(1- a)1/3]2 |
Three -dimensional diffusion (Jander equation) |
D4 |
(1-2/3 a) (1-a)2/3 |
Three -dimensional diffusion(Ginstling-Brounshtein equation) |
F1 |
-ln(1- a) |
Random nucleation with one nucleus on the individual particle |
F2 |
1/ (1- a) |
Random nucleation with two nuclei on the individual particle |
F3 |
1/ (1- a)2 |
Random nucleation with three nuclei on the individual particle |
Kissinger method has been used in the literature to determine the activation energy of solid state reactions from plots of the logarithm of the heating rate versus the inverse of the temperature at the maximum reaction rate in constant heating rate experiments.
The activation energy can be determined by Kissinger method without a precise knowledge of the reaction mechanism, using the following equation.
where b is the heating rate, Tp and ap are the absolute temperature and weight loss at the maximum weight-loss rate(da/dt)p ,respectively. A is the pre-exponential factor, and n is the reaction order.
From a plot of
2.2 Flynn-Wall-Ozawa method[6-8]
Eq (10) is integrated using the Doyle approximation[9,10]. The result of the integration after taking logarithms is
where b, A, Ea and T have the known meanings.
This is one of the integral methods that can determine the activation energy without a knowledge of reaction order. It is used to determine the activation energy for given values of conversion. The activation energy for different conversion values can be calculated from a log b versus 1000/T plot.
2.3 Friedman method[11-13]
This method is probably the most general of the derivative techniques and is based on the intercomparsion of the rates of conversion dα/dt for a given degree of conversion a determined using different heating rates b.
This method utilizes the following logarithmic differential equation derived from Eq . (5)
Using this equation, it is possible to obtain values for Ea over a wide range of conversions by plotting ln(da/dt)versus 1/T for a constant a value.
2.4 Coats-Redfern method[14,15]
Coats-Redfern used an approximation for the resolution of Eq. (10), obtaining
Activation energy for every degradation process listed in Table 1 can be determined from a plot of
3 EXPERIMENTAL
3.1 Material
The material evaluated in this study was PA12I which was synthesized by the following process:
Into a 100ml stainless steel autoclave 3 parts of dodecamethlyene diammonium isophthalate (PA12I salt) and 10 parts of distilled water were added. After purging several times under vacuum nitrogen repeatedly, the reactor was sealed and monomer/water mixture was heated to 220ºC over two hours period wherein the pressure finally reached to 2.3MPa. After the reaction was held at 220ºC for an hour , the pressure was decreased to atmospheric pressure by an open pipe through water seal tube in an hour. Then the vessel was kept at atmospheric pressure for two further hours. The gained polymer has a reduced viscosity of 1.17dl/g, measured in a 0.5g/dl solution in 96% sulfuric acid at 25ºC.
3.2 Apparatus
The thermogravimetric analysis was performed with NETZDCH TG 209 Thermal Analyzer. Samples were in an open platinum sample pan and the experiments conducted in N2 at a flow rate of 10 mL/min. The temperature was calibrated with indium. Nominal heating rates of 3ºC, 6ºC, 10ºC, 15ºC and25ºC/min were employed and continuous records of sample temperature, sample weight and its first derivative were taken.
3.3 Operating procedure
The PA12I degradation process is followed by monitoring weight loss according to temperature in a controlled atmosphere (N2). For these measurements, cylindrical alumina crucibles have been used in which every sample of PA12I has been placed without a previous treatment. Work conditions (gas flow, heating rate and polymer weight) have been separately established in every particular case. The temperature range of the experiments was between 30 and 550ºC in order to completely decompose the polymer and was conducted at a constant heating rate. 4 RESULTS AND DISCUSSION
Fig. 1 shows TG curves corresponding to dynamic experiments carried out at different heating rates: 3 , 6 , 10 , 15and 25ºC/min. We can see from Fig. 1 that these decomposition processes are a single-stage decomposition reaction where the procedural decomposition temperatures can be well defined. The degradation temperature rises with the increasing of the heating rate.
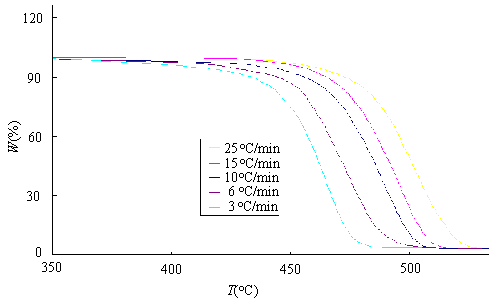
Fig.1 TG curves of PA12I thermal degradation at different heating rates.
Fig. 2 shows that heating
rates effect on the temperatures at the max weight-loss rate (Tp), at
the beginning(T0) and at the end(Tf) of the
weight-loss stage of TG. It was found that the values of Tp, T0
and Tf increase with the increasing of heating rates. Linear
fittings of T0, Tp and Tf versus b give Eq. (16), (17) and (18),
respectively:
![]() (16)
(16)
![]() (17)
(17)
![]() (18)
(18)
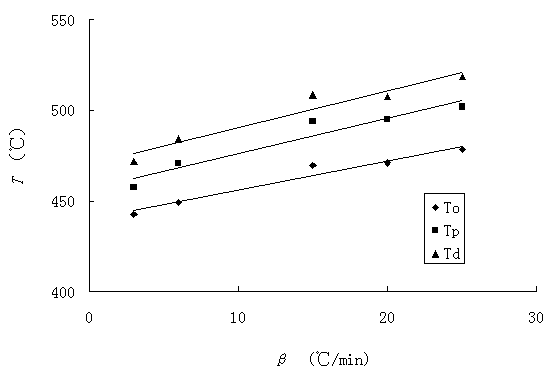
Fig. 2 Polts of ![]() versus
1000/TP at different heating rates according to Kissinger method.
versus
1000/TP at different heating rates according to Kissinger method.
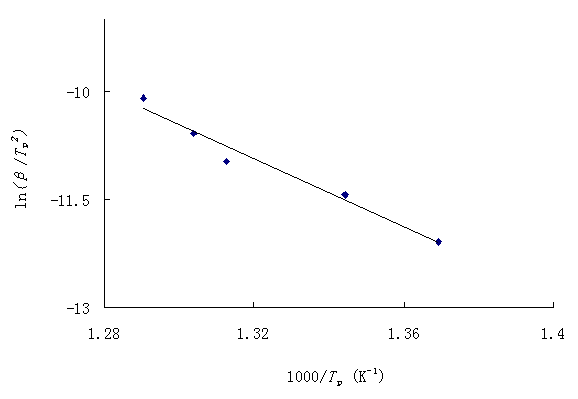
Fig. 3 Polts of the thermal decomposition
temperatures versus heating rates.
The equilibrium degradation temperatures are
gained by extrapolation of T0, Tp and Tf
to b=0: ![]()
Using Kissinger method, Eq. (11), the activation energy can be calculated from a plot of
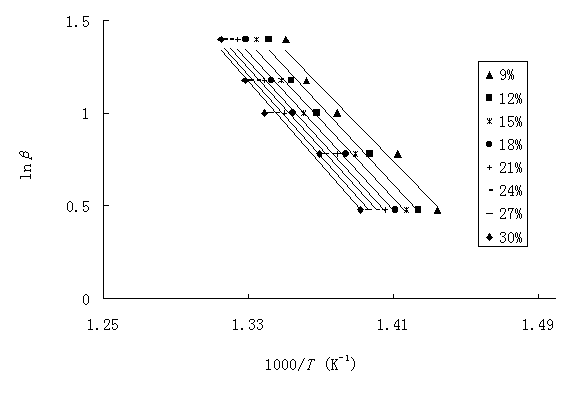
Fig. 4 Polts of log b versus 1000/T with weight loss from 9% to 30% in steps of 3% according to Flynn-Wall-Ozawa method (b=3, 6, 10, 15, 25).
The activation energy can also be determined using the method of Flynn-Wall-Ozawa, Eq. (12), from a linear fitting of ln
b versus 1000/T at different conversions(Fig. 4). Owning to the fact that this equation was derived using the Doyle approximation, only conversion values in the low range can be used. For this study, we have used the conversion values: 9, 12, 15, 18, 21, 24, 27 and 30%. Fig. 4 shows that the fitting straight lines are nearly parallel, thus indicating the applicability of this method to our PA12I system in the conversion range studied. This fact suggests that a single reaction mechanism is operative[16,17]. Activation energies corresponding to the different conversions are listed in Table 2. From these values a mean value of 194.81kJ/mol was found. Table 2 also shows that the activation energy is very close to the value obtained using Kissinger method.Table 2 Activation energies obtained by using Flynn-Wall-Ozawa method
a( %) |
Ea(kJ/mol) |
r* |
9 |
182.5 |
0.9751 |
12 |
191.9 |
0.9826 |
15 |
193.0 |
0.9829 |
18 |
194.4 |
0.9833 |
21 |
195.7 |
0.9823 |
24 |
197.3 |
0.9817 |
27 |
199.4 |
0.9812 |
30 |
204.3 |
0.9780 |
Average |
194.81 |
*
Correlation coefficientCompared to other methods these two methods present the advantage that they do not require previous knowledge of the reaction mechanism for determining the activation energy. Some authors[2,18] used the activation energies obtained using these two methods to check their thermal degradation mechanism models.
Table 3 Dependence of Activation energy upon fractional weight loss according to Friedman method
a( %) |
Ea |
r |
9 |
195.21 |
0.9951 |
12 |
196.26 |
0.9527 |
15 |
203.69 |
0.9754 |
18 |
207.89 |
0.9716 |
21 |
212.36 |
0.9577 |
24 |
217.78 |
0.9496 |
27 |
224.70 |
0.9490 |
30 |
226.76 |
0.9589 |
Average |
210.58 |
In addition, the activation energy can also be determined using the method of Friedman, Eq. (13), from a linear fitting of ln(d
a/dt)versus 1000/T for a constant a value. The kinetic parameters obtained by this method have been summarized in Table 3. From these values a mean value of 210.58 kJ/mol is found. And this value is also very close to the value obtained using Kissinger method.Table 4 Activation energies obtained using the Coats-Redfern method for several solid state processes at a heating rate of 3
ºC/minMechanism |
Ea(kJ/mol) |
LnA (min-1) |
r |
A2 |
119.44 |
16.99 |
0.9991 |
A3 |
75.70 |
9.39 |
0.9990 |
A4 |
53.83 |
5.48 |
0.9989 |
R1 |
225.80 |
34.77 |
0.9985 |
R2 |
237.99 |
36.24 |
0.9900 |
R3 |
242.16 |
36.58 |
0.9990 |
D1 |
463.36 |
74.06 |
0.9986 |
D2 |
479.22 |
76.18 |
0.9989 |
D3 |
496.06 |
77.63 |
0.9991 |
D4 |
484.91 |
75.66 |
0.9990 |
F1 |
250.65 |
39.19 |
0.9992 |
F2 |
39.81 |
15.73 |
0.9452 |
F3 |
91.40 |
13.21 |
0.9576 |
Table 5 Activation energies obtained using the Coats-Redfern method for several solid state processes at a heating rate of 6
ºC/minMechanism |
Ea(kJ/mol) |
LnA (min-1) |
r |
A2 |
145.99 |
21.99 |
0.9930 |
A3 |
93.32 |
12.95 |
0.9924 |
A4 |
66.99 |
8.37 |
0.9918 |
R1 |
270.60 |
42.35 |
0.9954 |
R2 |
286.97 |
44.49 |
0.9945 |
R3 |
292.57 |
45.05 |
0.9942 |
D1 |
553.22 |
88.40 |
0.9956 |
D2 |
574.61 |
91.38 |
0.9950 |
D3 |
591.94 |
92.86 |
0.9923 |
D4 |
582.12 |
91.16 |
0.9948 |
F1 |
304.02 |
48.14 |
0.9935 |
F2 |
57.54 |
14.01 |
0.9367 |
F3 |
127.10 |
19.84 |
0.9474 |
Table 6 Activation energies obtained using the Coats-Redfern method for several solid state processes at a heating rate of 10
ºC/minMechanism |
Ea(kJ/mol) |
LnA (min-1) |
r |
A2 |
126.98 |
18.62 |
0.9991 |
A3 |
80.57 |
10.87 |
0.999 |
A4 |
57.37 |
6.88 |
0.9989 |
R1 |
240.17 |
36.79 |
0.9985 |
R2 |
252.94 |
38.28 |
0.9900 |
R3 |
257.31 |
38.62 |
0.9990 |
D1 |
492.58 |
76.93 |
0.9986 |
D2 |
509.30 |
79.06 |
0.9989 |
D3 |
526.85 |
80.53 |
0.9991 |
D4 |
515.14 |
78.55 |
0.9990 |
F1 |
266.20 |
41.24 |
0.9992 |
F2 |
41.75 |
4.64 |
0.9452 |
F3 |
95.75 |
14.49 |
0.9576 |
Using Eq. (14), proposed by Coats and Redfern, the activation energy for every g(
a) function listed in Table 1 can be obtained at constant heating rates from fitting of5 CONCLUSIONS
The study of master curves together with interpretation of method allows confirmation that
the PA12I system here studied follows a deceleration R1 thermal
degradation mechanism in the conversion range considered. Additionally, the results given
by the Kissinger,Friedman and Flynn-Wall-Ozawa
methods are in good agreement with each other.
ACKNOWLEGEMENTS
The financial support provided by Henan Province (China) for outstanding youthful and
middle-aged teacher. The authors gratefully thank Ms. Shen Xiaoqing for the TG
measurement.
REFERENCES
[1] Wang F Y, Ma C C, Wu W J. J Appl Polym Sci, 2001, 80: 188.
[2] Ma S, Hill J O, Heng S. J Therm Anal, 1991, 37: 1161.
[3] Hatakeyama T, Quinn F X. Thermal analysis. Fundamentals and applications to polymer
science, England: Wiley, 1994.
[4] Núnez L, Fraga F, Núnez M R et al. Polymer, 2000, 41: 4635.
[5] Kissinger H E. Anal Chem, 1957, 29: 1702.
[6] Flynn J H, Wall L A. J Res Nat Bur Stand A Phys Chem, 1966, 70A: 487.
[7] Flynn J H, Wall L A. Polym Lett, 1966, 4: 323.
[8] Ozawa T. Bull Chem Soc Jpn, 1965, 38: 1881.
[9] Doyle C D. J Appl Polym Sci, 1961, 5: 285.
[10] Doyle C D. Nature, 1965, 207: 240.
[11] Friedman H L. J Polym Sci, Part C, 1964, 6: 183.
[12] Li X G, Huang M R, Guan G H, Sun T. Polym Int, 1998, 46: 289.
[13] Li X G, Huang M R, Guan G H. Polym Degrad Stab, 1999, 64: 81.
[14] Coats A W, Redfern J P. Nature, 1965, 207: 290.
[15] Coats A W, Redfern J P. Nature, 1964, 201: 68.
[16] Flynn J H. Polym Eng Sci, 1985, 20 (10): 675.
[17] Flynn J H. J Therm Anal, 1988, 34: 367.
[18] Jimenez A, Berenguer V, López J, Sanchez A. J Appl Polym Sci, 1993, 50: 1565.