http://www.chemistrymag.org/cji/2004/069062pe.htm |
Sep. 1,
2004 Vol.6 No.9 P.62 Copyright |
(The Key Laboratory of Bioactive materials, Ministry of Education, Nankai University, Tianjin 300071, China) Received June 6, 2004; Supported by Nankai University Science and Technology Fundation (A01544), and Tianjin Science and Technology Develop Program (2004).
The microfluidic network (mFN) technology device have been developed that can adsorb proteins from solution, DNA hybridization, immunoassay and cellular cocultures onto solid-liquid interface, and release them on command. This review describes some of the creating two-dimensional (2D) and three-dimensional (3D) microfluidic systems currently employed for biomolecular recognition on the solid-liquid interface, and research results regarding their effectiveness. In addition, the applications of the impact of
mFN technology on the field of biosciences are also presented.Keywords Microfluidic network (mFN), Solid-liquid interface, Proteins, DNA hybridization, Immunoassay, Cell adhesion.
1 INTRODUCTION
In recent years, "Lab-on-a-chip" technology lie in the consumption of a small amount of the sample and reagents, fast processing time, and high throughput compared to macroscopic systems. Manipulating gas and liquid fluids within networks of microchannels is crucial in the design and fabrication of microfluidic devices for applications in bioassays, microreactors, and chemical and biological sensing [1], analysis of DNA and protein [2], sorting of cell [3], high-throughput screening [4], chemical reactions [5], and transfers of small volumes (1 to 100 nL) of materials [6]. Many techniques including mechanical pumping [7], electro-osmotic flow (EOF) [8], electro wetting [9], electrochemistry [10], and thermo capillary pump [11] have been used to pump, transport, position, and mix liquid samples. Surface properties, especially wetting, have significant effects on liquid behaviour [12] when the system is reduced to a submillimeter scale.
2. IMMOBILIZATION AND DETECTION OF PROTEINS
ON MICROFLUIDIC CHANNELS
Microfluidic networks (mFN) are passive devices incorporating microchannels
for guiding minute volumes of fluids over surfaces. mFN have high-resolution and
high-contrast capabilities for simultaneously patterning lines of proteins onto a surface [13].
There are several techniques to displace fluids in microchannels, and a variety of
materials can be structured to fabricate the necessary mFN. For example, the mFN represents
a compelling approach for the patterning of biological molecules, because these devices
can guide solutions of proteins conveniently over regions of a substrate to localize the
adsorption of proteins. There are several requirement concerning substrates and mFN for a
successful patterning of proteins [14]. Jin et al. described the use of a
microchip-based proteolytic digestion system driven by electroosmotic pumping. The
proteins were electroeluted into the microfluidic system directly from the acrylamide gel,
and tryptic digestion was performed simultaneously to the elution step. The digestion of b-casein, cytochrome c,
and bovine serum albumin was completed in 12 min [15]. Three-dimensional
microfluidic systems were fabricated and used to pattern proteins on a planar substrate.
The three-dimensional topology of the microfluidic network in the stamp makes this
technique a versatile one with which to pattern multiple types of proteins in complex,
discontinuous structures on a surface. This method is based on a procedure described by
Anderson et al. [16] for fabricating 3D microchannel systems and is
related to work described by Jo et al. [17] and others for 3D
microfabrication. Although the potential value of 3D microfluidic systems is intuitively
obvious (especially for procedures that require patterning liquids or require patterning
with liquids), the complexity in the fabrication of such systems has deterred their use.
To demonstrate, Whitesides G M et al [18] designed and fabricated a
two-layer microfluidic system for delivering two proteins in a nested spiral arrangement.
There would be difficult to create this pattern with mCP because it would be difficult to ink
differentially the two spirals (which are separated by only 200 mm). The spiral that is
more fluorescent in Figure 1 is BSA, a protein that use routinely to inhibit cell
attachment to surfaces; the one that is less fluorescent is fibrinogen, a protein that
promotes cell attachment.
 ��
�� 
Fig.1 Fluorescence photograph (B)
showing nested spirals of two proteins on the surface of a polystyrene Petri dish
patterned with the 3D stamp depicted in A. The bright green spiral is BSA; the
light green one is fibrinogen. Both proteins were labeled with FITC. The BSA concentration
used (1 mg/ml) was approximately 10 times higher than that of fibrinogen (0.1 mg/ml). To
create this nested spiral pattern, the PDMS stamp (A) first was placed conformally
to the polystyrene surface of the Petri dish. The two nested spiral channels then were
filled with FITC-tagged BSA and fibrinogen in phosphate buffer (pH 7.4), respectively. The
proteins were allowed to adsorb onto the polystyrene surface for 45 min. The
channels were flushed thoroughly with phosphate buffer (pH 7.4); the stamp was peeled off;
the picture was taken.
This nested spiral was patterned in four steps: (1) the stamp containing the channel system suggested by Figure 1A was placed in contact with the surface of a polystyrene Petri dish; (2) the two channels were filled with BSA and fibrinogen both labeled by reaction with FITC; (3) the proteins were allowed to adsorb onto the surface of the polystyrene for 45 min; and (4) the channels were flushed thoroughly with phosphate buffer, and the stamp was peeled away. The BSA spiral is more fluorescent because the concentration of BSA used (1 mg per mL of phosphate buffer) was higher than that of fibrinogen (0.1 mg per mL of phosphate buffer). The different mFN may also be useful in combinatorial chemistry and in new technologies involving cell guidance, 2-D protein microsynthesis, and construction of enzyme microcascades. Also, sequential mFN of different proteins onto a single region may enable construction of 3-D protein ensembles. Zheng et al. described a microfluidic device for screening hundreds of protein crystallization conditions using less than 4 nL of protein solution for each crystallization trial. These trials were set up inside 7.5 nL aqueous droplets that were formed in the flow of immiscible fluids. Each droplet contained a solution of protein, precipitants, and additives in variable ratios [19].
3. IMMOBILIZATION AND DETECTION OF DNA
HYBRIDIZATION ON MICROFLUIDIC CHANNELS
A microfluidic devices have been reported in the literature ranging from single chips
for polymerize chain reaction (PCR) to complete analysis systems. Ultimately they are more
versatile than surface-based microarray systems, as microfluidic systems afford greater
control of material location [20]. On-site analysis of patient samples could
demonstrate the presence of bacterial DNA and any susceptibility to antibiotic treatment [21].
Craighead, H. G., et al. [22], have been extending these a nanofluidic channel
device, consisting of many entopic traps, was designed and fabricated for the separation
of long DNA molecules. The channel comprises narrow constrictions and wider regions that
cause size-dependent trapping of DNA at the onset of a constriction. Samples of long DNA
molecules (5000 to - 160,000 base pairs) were efficiently separated into bands in
15-millimeter-long channels. Multiple-channel devices operating in parallel were
demonstrated. The efficiency, compactness, and ease of fabrication of the device suggest
the possibility of more practical integrated DNA analysis systems. Crooks R M et al. [23]
report a simple and efficient method for concentrating analytes DNA in a microfluidic
channels. The method relies on exerting spatial control over the electrokinetic velocity
of the analyte. Specifically, the electroosmotic (EO) velocity of the buffer solution in
one region of a microfluidic system opposes the electrophoretic (EP) velocity of the
analyte in a second region. Figure 2. show optical micrograph of the microfluidic system
used for DNA concentration enrichment.
Fig.2 (a) Optical micrograph of the microfluidic system used for DNA concentration enrichment. The uneven background results from light scattering off the porous membrane. The distance between the electrodes in the source and waste reservoirs is 1 cm. (b) Fluorescence micrograph of the region shown in (a) before application of a bias voltage. (c) Fluorescence micrograph obtained after applying a 100 V forward bias for 68 s. Immediately after the micrograph in (c) was obtained, the bias was reversed, and 36 s later the fluorescence micrograph in (d) was obtained. Before applying the bias, the channels and waste reservoir were filled with 1��TBE buffer, and the source reservoir was filled with 1��TBE buffer containing 10 mg/mL DNA.
This results in EP transport of DNA to a location where the EP and EO velocities are equal and opposite, and DNA concentrates at this location. This new approach requires no complex microfabricated structures and no special manipulation of the solvent, and the concentrated analyte remains in solution rather than being captured on a solid support. Forthcoming reports will focus on mechanistic studies of the observed phenomemon and coupling preconcentration with other fluidic operations such as sample injection. Krishnan M et al [24] reports a method for PCR in a Rayleigh-Bernard convection cell. The RB-PCR system is exceedingly simple and may be easily assembled in any laboratory. The potential versatility of this system may be further enhanced through improved characterization of convective flow fields in high aspect ratio cavities and studies to optimize PCR in flowing systems. Landers' group used hydroxyethyl cellulose and hydroxypropyl cellulose as adsorptive coating sieving matrixes for DNA separation, fragment analysis, and mutation detection via heteroduplex analysis [25]. Duong et al. achieved length-dependent DNA migration and separation of l
-DNA and T2-DNA molecules in a gel-free system using topographically structured microfluidic PDMS channels with periodical cavities in the range of the radius of gyration of the tested DNA molecules [26]. Inatomi et al. separated DNA electrophoretically in an array of 15-mm pillars fabricated in poly(dimethylsiloxane) [27]. By employing a nanopillar structure on a quartz chip as a sieving matrix, Kaji et al. fractionated long DNA molecules under a dc electric field [28]. Blazej et al. used a microfabricated capillary array electrophoresis device to screen for sequence variations in two human mitochondrial genomes [29].4. IMMOBILIZATION OF ANTIBODIES IN MICROCHANNELS FOR IMMUNOASSAY, AND CELL ADHESION BY
mFNMicrofluidic devices have gained a great deal of attention over the last several years due to their potential for creating inexpensive analytical tools with minute volumes and high throughput as well as for their potential for mass replication [30]. A host of diagnostic applications can be coupled to these systems for immunoassay development [31]; biosensor design [13], genetics [32], and cell screening [21], Furthermore, microfluidics can be exploited for patterning surfaces with biological materials at micrometer-scale resolution. There have been several reports dealing with patterning proteins [10], cells [32], and planar lipid baitlayers [33]. The immunoassay is arguably the most important analysis method for biological molecules. Immunoassays are a popular method in many clinical applications and form the basis of a wide array of biochemical, environmental, and biological investigations [34]. Other soft lithographic techniques using microfluidic channels [35] and microwells [36] have also been developed to pattern cells on glass and plastic surfaces.
Delamarche E et al, [37] describe a new format for immunoassays. In practice, a microfluidic network (mFN) patterns a series of antigens as narrow stripes onto a planar substrate, after a blocking step with BSA, the antigens in each line may be recognized by specific analyses from a sample solution also guided over the substrate with a second mFN, then call this assay a micromosaic immunoassay (mMIA). They therefore prepared a substrate with lines of guinea pig IgGs (antigens) and delivered solutions of anti-guinea pig IgGs (analytes; tagged with TRITC) with decreasing concentration to this surface, Figure 3A. The fluorescence associated with the analyte bound to the surface reveals that their binding and detection occurred over a wide range of concentrations. The graph in Figure 3B reflects a "igmoidal binding behavior" between the two partners as is usually observed in a standard ELISA analysis. The fitting of the titration curve in Figure 3B yields a dissociation constant of 38 �� 12 nM, which is a typical value for the affinity of polyclonal antibodies such as the ones used here.
 ��
��
(A) Immunofluorescence image of TRITClabeled anti-guinea pig antibody bound to lines of guinea pig IgGs on the surface. Solutions of the labeled antibodies filled the second mFN with concentrations from 660 nM (100 mg mL-1) down to 40 pM (6 ng mL-1). The image is composed of two frames acquired from adjacent regions of the sample (dashed line); part of the second frame is displayed with a higher brightness (inset). (B) Average fluorescence in the squares is plotted against the concentration of the anti-guinea pig IgGs. The dashed line indicates the measured background fluorescence.
For lower concentrations of analytes,
better antibodies and a sandwich-type assay format are preferred. Such mosaic-format
immunoassays are compatible with the sensitivity and reliability required for
immunodiagnostic methods. Jiang and co-workers described a microfluidic version of a
parallel, serialdilution fluorescent immunoassay and with this determined the
concentration of antibodies in human serum containing HIV [38]. Saleh and Sohn
demonstrated a rapid and highly sensitive technique to perform immunoassays in both
inhibition and sandwich configurations. This technique is based on the resistive pulse
method of particle sizing with a pore to detect the binding of unlabeled antibodies to the
surface of latex colloids [39].
The ability to design and create biologically relevant patterns on
surfaces provides new capabilities for cell biology, the production of biosensors, and
tissue engineering [40]. Whitesides G M et al describes a versatile technique
for fabricating complex patterns of biological materials and cells on surfaces by using
three-dimensional (3D) microfluidic systems [16, 17]. They fabricated a
two-layer stamp for the deposition of two cell types in a concentric square pattern (Fig.
4). They designed this discontinuous, concentric pattern to demonstrate our ability to
handle thin PDMS membranes without distortion, because the membrane was supported and
attached to the wafer (the master with features) by van der Waals interactions at
all times. It also would be difficult to use either

Fig.4 Fluorescence (B) and phase-contrast (C and D) pictures of two cell types deposited on a tissue culture dish in a concentric square pattern by using the 3D stamp depicted in A. The cells that appear green are ECVs labeled with CMFDA; the cells that appear red are BCEs labeled with DiI-conjugated acetylated low density lipoprotein. These cells were labeled fluorescently before being deposited. Before patterning cells, the PDMS stamp first was autoclaved for 20 min, then the channel walls were coated with BSA (30 mgyml in pH 7.4 phosphate buffer for 1 hr) for preventing cell attachment to the PDMS stamp. Suspensions of cells ( 5 million cells/mL) were introduced into the three sets of channels and were allowed to sediment and attach to the surface of the tissue culture dish. These cells were cultured with the stamp in place for 24 hr to grow and spread into a confluent layer. The pictures were taken immediately after the PDMS stamp was removed; these cells were immersed under media and were alive. An expanded view of the lower right corner of C is shown in D. This new strategy works identified proteins involved in tyrosine kinas signaling, apoptosis and cell adhesion, and with distinct subcellular distributions. The ability to pattern deposit different cell types, in close proximity and in well-defined structures, will pave the way for studying the functional significance of tissue architecture at the resolution of individual cells, and the molecular interactions between cell types that underlie processes such as embryonic morphogenesis, formation of the blood brain barrier, and tumor angiogenesis. Cell cultivation was performed in a highly parallelized manner in fluid segments that were formed as droplets at a channel junction where organic and cell containing aqueous phase were merged [43]. Brischwein and co-workers reported a chip device with potentiometric, amperometric and impedimetric sensors to enable investigations of cellular microphysiological patterns [44].
Rubinsky B et al.[45] have designed and fabricated a chip to measure electrical currents that flow through single cells. For the purpose of detecting cell viability, the electrical measurements were correlated with conventional fluorescent dye assays that are typically used to distinguish between dead and live cells. This similar biosensors might be used as a 'canary on a chip', detecting and warning of toxins or biowarfare agents just as miners once used canaries to alert them to noxious gases. The device could fit into a tiny remote sensor in a war zone, for example.
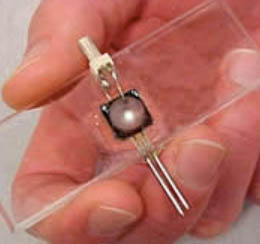
Fig.5 The single-cell sensor could screen drugs for toxicity
The technique might replace a more laborious one commonly used to tell apart living and dead cells. Cells are soaked in dyes that penetrate only the broken membrane of dead cells; samples are then scanned for coloured, lifeless cells. Matsubara et al. developed a microfluidic cell chip for monitoring the allergic response upon application of antigen stimulus [46].
REFERENCES
[1] Freemantle M. Chem. Eng. News, 1999, 77 (8): 27.
[2] (a) Service R F. Science, 1998, 282: 399. (b) Burns M A. Johnson B N. Brahmasandra S
N. et al. Science, 1998, 282: 484.
[3] Chou H P, Spence C, Scherer A et al. Proc. Natl. Acad. Sci. USA., 1999, 96: 11.
[4] Dunn D A, Feygin I. Drug Discovery Today, 2000, 5: S84-S91.
[5] Losey M W, Schmidt M A, Jensen K F. Ind. Eng. Chem. Res., 2001, 40: 2555.
[6] Sammarco T S, Burns M A. AIChE J., 1999, 45: 350.
[7] (a) Unger M A, Chou H P, Thorsen T et al. Science, 2000, 288: 113. (b) Fahrenberg J,
Bier W, Maas D et al. Micromech. Microeng., 1995, 5: 169. (c) Goll C, Bacher W, Bustgens B
et al. Micromech. Microeng., 1996, 6: 77-79. (d) Yang X, Grosjean C, Tai Y C et al. Sens.
Actuators A., 1998, 64: 101.
[8] (a) Harrison D J, Fluri K, Seiler K et al. Science, 1993, 261: 895. (b) Salimi-Moosavi
H, Tang T, Harrison D J. J. Am. Chem. Soc., 1997, 119: 8716.
[9] Beni G, Tenan M A. J. Appl. Phys., 1981, 52: 6011.
[10] Gallardo B S, Gupta V K, Eagerton F D et al. Science, 1999, 283: 57.
[11] (a) Kataoka D E, Troian S M. Nature, 1999, 402: 794. (b) Burns M A, Mastrangelo C H,
Sammarco T S et al. Proc. Natl. Acad. Sci. USA., 1996, 93: 5556.
[12] Adamson A W. Physical Chemistry of Surfaces. Wiley, New York, 1990.
[13] Delamarche E, Bernard A, Schmid H et al. Science, 1997, 276: 779.
[14] (a) Rowe C A, Scruggs S B, Feldstein M J et al. Anal. Chem., 1999, 71: 433. (b)
Geissler M, Bernard A, Bietsch A et al. J. Am. Chem. Soc., 2000, 122: 6303.
[15] Jin L J, Ferrance J, Sanders J C et al. Lab Chip, 2003, 3, 11.
[16] Anderson J R, Chiu D T, Jackman R J et al. Anal. Chem, 2000, 72: 3158.
[17] Jo B H, VanLerberghe L M, Motsegood K M et al. J. Microelectromech. Syst., 2000, 9
(1): 76.
[18] Chiu D T, Jeon N L, Huang S et al. Proc. Natl. Acad. Sci. USA., 2000, 97 (6): 2408.
[19] Zheng B, Roach L S, Ismagilov R F. J. Am. Chem. Soc., 2003, 125, 11170.
[20] Andersson H. Microfluidic Devices for Biotechnology and Organic Chemical
Applications, Royal Institute of Technology, 2001, p18.
[21] Kopp M U, De Mello A J, Manz A. Science, 1998, 280: 1046.
[22] Han J, Craighead H G. Science, 2000, 288: 1026.
[23] Dai J H, Ito T, Sun L et al. J. Am. Chem. Soc., 2003, 125: 13026.
[24] Krishnan M, Ugaz V M, Burns M A. Sciences, 2002, 298 (25): 793.
[25] (a) Sanders J C, Breadmore M C, Kwok Y C et al. Anal. Chem. 2003, 75: 986. (b) Tian H
J, Landers J P. Anal. Biochem. 2002, 309, 212.
[26] Duong T T, Kim G, Ros R et al. Microelectron. Eng. 2003, 67-68: 905.
[27] Inatomi K I, Izuo S I, Lee S S et al. Microelectron. Eng. 2003, 70: 13.
[28] Kaji N, Tezuka Y, Takamura Y et al. Anal. Chem. 2004, 76: 15.
[29] Blazej R G, Paegel B M, Mathies R A. Genome Res. 2003, 13: 287.
[30] Burns M A, Mastrangelo C H, Sammarco T S. Proc. Natl. Acad. Sci. U.S.A., 1996, 93:
5556.
[31] (a) Singhvi R, Kumar A, Lopez G P et al. Science, 1994, 264: 696. (b) Kovacs G T A,
Petersen K, Albin M. Anal. Chem., 1996, 68: A407.
[32] Blankenstein G, Larsen U D, Biosens. Bioelectron, 1998, 13: 427.
[33] Van der Schoot B H, Jeanneret S, Van den Berg A et al. Sens. Actuators B, 1993,
13-14: 333.
[34] Bratten C D T, Cobbold P H, Cooper J M. Anal. Chem., 1997, 69: 253.
[35] (a) Folch A, Toner M. Biotechnol. Prog. 1998, 14: 388. (b) Ostuni E, Chen C S, Ingber
D E et al. Langmuir, 2001, 17: 2828.
[36] Matsue T, Koike S, Uchida I. Biochem. Biophys. Res.Commun. 1993, 197: 1283.
[37] Bernard A, Michel B, Delamarche E. Anal. Chem. 2001, 73: 8.
[38] Jiang X Y, Ng J M K, Stroock A D et al. J. Am. Chem. Soc. 2003, 125, 5294.
[39] Saleh O A, Sohn L L. Proc. Natl. Acad. Sci. U.S.A. 2003, 100, 820.
[40] (a) Kovacs G T A. (1998) Micromachined Transducers Sourcebook (WCBy McGraw-Hill,
Boston). (b) Kane R S, Takayama S, Ostuni E et al. Biomaterials, 1999, 20: 2363.
[41] (a) Chen C S, Mrksich M, Huang S et al. Science,1997, 276: 1425. (b) Bernard A,
Delamarche E, Schmid H et al. Langmuir, 1998, 14: 2225.
[42] (a) Jeon N L, Choi I S, Xu B et al. Adv. Mat. 1999, 11: 946. (b) Delamarche E,
Bernard A, Schmid H et al. J. Am. Chem. Soc., 1998, 120: 500. (c) Folch A, Ayon A, Hurtado
O et al. J. Biomech. Eng., 1999, 121: 28. (d) Folch A, Toner M. Biotech. Prog., 1998, 14:
388.
[43] Martin K, Henkel T, Baier V et al. Lab Chip 2003, 3, 202.
[44] Brischwein M, Motrescu E R, Cabala E et al. Lab Chip 2003, 3, 234.
[46] Matsubara Y, Murakami Y, Kobayashi M et al. Biosens. Bioelectron. 2004, 19: 741.
�� ��