http://www.chemistrymag.org/cji/2005/075040pe.htm |
May 28, 2005 Vol.7 No.5 P.40 Copyright |
Zeng Gucheng1, Wang Hao2,
Xu Yanfang1, Shi Jintao3, Pan Yunlong 1, 3, Cai Jiye 1
(1Department of Chemistry, Jinan University, Guangzhou510632; 2
Institute of Optoelectronic Material and Technology, South China Normal University,
Guangzhou510631; 3 The First Affiliated Hospital of Jinan University,
Guangzhou510632, China)
Received on Mar. 12, 2005; Supported by National Natural Science Foundation of China (No. 30230350, 60278014) and Natural Science Foundation of Guangdong (36704).
Abstract While fluorescent
semiconductor nanocrystals (quantum dots, QDs) have been demonstrated to be a promising
nanomaterial in biological labeling, there is no report describing the cellular uptake of
QDs that visualized through atomic force microscopy (AFM). In this work, K562 cells were
cultured in the presences of transferrin(Tf)- conjugated QDs. The extracellular and
intracellular nanostructures of K562 cells were analyzed by AFM, transmission electron
microscope (TEM) and confocal microscopic, respectively. Results revealed that the
ligand-conjugated QDs are highly specific and potent to the cellular surface receptor.
This work would provide more information for the application of QDs in biolabeling
Keywords Quantum dots, Atomic force microscopy, K562 cell, Transferrin
1. INTRODUCTION
Recently, due to their narrow and size tunable emission spectra and photostability and
outstanding biocompatible ability both in vitro and vivo, quantum dots (QDs)
have been employed to biological imaging and showed their advantages over traditional dyes[1-13].
One important usage of ligand-conjugated QDs is the targeting of these conjugated to cell
surface receptors. Nie's group [11] showed their earlier efforts to demonstrate
that QDs bioconjugates were transported into the cells by receptor-mediated endocytosis
and detected the clusters and aggregates on cell surfaces. Aoyama's group [12] presented
an experiment to reveal the size effect of endocytosis in the subviral region and
demonstrated that the endocytosis is highly size dependent because the size
complementarity governed the molecular recognition in small host-guest systems. Rosenthal
and coworkers [13] demonstrated that serotonin-labeled nanocrystals (SNACs)
interact with the serotonin transporter protein (SERT) in transfected HeLa cells and
oocytes in vitro. They also demonstrated that fluorescent SNACs could be used to
visualize SERTs expressed in human epithelial kidney cells in an antidepressant-sensitive
manner.
However, at present, little is known about the nanostructures of cell
surface responded to QDs labeling and receptor-mediated endocytosis of ligand-conjugated
QDs. At nanometer scale, cell surface structure might have a role in shaping the function
of the particular protein molecules on cellular membrane. By monitoring the cellular
nanostructures, ligand-conjugated QDs were expected to impel the advancement of important
biological and immunological applications of QDs in targeted drug delivery, protein
transportation, ligand-receptor binding and signal transduction. Our previous work
[14, 15] has demonstrated that AFM is emerging as a powerful tool of
bionanotechnology in biomolecular and cellular bio-analysis. Therefore, the direct
nanometer scale visualizations by AFM and determination of different responses of cellular
uptake of nanocrystals may elicit particular molecules recognition and offer new insights
into the application of nanocrystals in biotechnology. In this paper, we made use of AFM
to visualize the uptake of QDs by K562 cells. We then used TEM and confocal microscopy to
further reveal that the QDs were internalized into cells. With a combined method of AFM,
TEM and confocal, we demonstrated that Tf-conjugated QDs could interact with the
transferrin receptor (TfR) expressed on K562 cells highly specific and potently. This
experiment revealed that, with QDs, AFM should provide novel insights into the
receptor-mediated transductions and molecule detection.
2. EXPERIMENT
2.1 Reagents
Biotin-transferrin was purchased from Molecular Probes (Eugene, OR, USA). QDs
Streptavidin Conjugated 605 nm was purchased from Quantum dot (Hayward, CA, USA). All
other reagents were of analytical grade.
2.2 Cell culture and incubation of ligand-conjugated QDs
The K562 cells were seeded in Lab-Tek chambered 6-well (Nunc) and grown in RPMI 1640
medium with glutamax supplemented with 10% fetal calf serum in a 5% CO2
atomsphere at 37ºC. Cells were incubated with Tf-QDs with about 10 minutes. The cells
were centrifuged to remove the unbounded Tf-QDs and were fixed by 4% formaldehyde. As for
consecutive binding of biotin-Tf and QDs, cells were labeled with 1.9ng/ml biotin-Tf in
culture medium and then incubated for various times with 200pm QDs, washed, centrifuged
and fixed for imaging. Tf-QDs complex were formed by the incubation of biotin-Tf with
streptavidin-QDs at 4ºC with mixing for over
30mins (Scheme1).
Scheme 1 Formation principle of Tf-QDs. The elements of Tf-QDs are
roughly to scale. The high binding affinity between biotin and streptavidin will offer a
complex of Tf-QDs with high stability.
2.3 Microscopy
AFM was performed in air and in contact mode using a commercial AFM (AutoProbe CP,
Veeco, CA). The AFM images were planar-leveled using the software provided with the
manufacturer (Thermomicroscopes Proscan Image Processing Software Version 2.1). Confocal
microscopy was performed under a MRC600 (BIO-RAD, USA) confocal scanning
microscope. The sample preparation and imaging steps for TEM referred to our
previous work [16].
3. RESULTS AND DISCUSSIONS
3.1 Effects of QDs uptake on intracellular and extracellular nanostructures of K562 cells
AFM has rapidly become one of the most widely used methods for studying nanostructures of
living cells and biomolecules [15]. One of the most attractive advantages of
AFM is that, while many other methods such as SEM and TEM required complex
pre-preparation, which usually damaged the cell surface molecules, AFM could be performed
under near physiological condition. Therefore, we have a good reason to predict that the
nanostructures acquired by AFM should display the cellular surface molecular spatial
distribution, functional group terminal, and molecular connection in nature. Fig1A is a
typical K562 cell with a diameter about 15mm. As revealed by Fig.2B, compared to the
blank cells Fig1B, surprisingly, several large holes appeared on cell surface. The linear
analysis of AFM indicated that the larger holes are almost about 746nm (Fig 2 C).
Fig.1 (a) A represented AFM topographic image of control K562 cells.
(b) Ultrastructure of control K562 cells.
Fig.2 (a) A represented AFM topographic image of K562 cells that
incubated in Tf-QDs conjugates. (b) Ultrastructure of K562 cells that incubated in Tf-QDs.
(c) The height profile of the hole in (b). The white arrows show the typical holes on cell
surface.
Although, basically, all
the cells should have micro-holes so that they can absorb the nutrition to keep their
viability, the characterized large holes on cellular surface after the uptake are
attributed to at least three factors. First, because the carcinoma cells are especially
active in the absorption of outer nutrition molecules and the cross membrane uptake of
Tf-QDs by K562 cells should rely on the holes on cell membrane, the cells tended to expand
the holes on membrane so that they can transform the Tf-QDs. Secondly, the cellular uptake
of nanocrystals, which provide larger ratio of surface-area to volume, should be more
easily than other regular molecules at micrometer scale because the contact areas between
QDs and cell surface receptors should be larger significantly than regular molecules.
Thirdly, the adding of Tf that coated on QDs stimulate the activity of TfRs on cell
membrane so that the absorption of cell is more active than other times.
Fig.3 (a) A represented AFM topographic image of K562 cells that
incubated in Tf and QDs subsequently. (b) Ultrastructure of K562 cells that incubated in
Tf and QDs subsequently.
(a)
(b)
Fig. 4 TEM images of ultrasection of control K562 cells (a) and K562
cells (b) incubated in Tf-QDs. Arrows indicated where the QDs were potentially localized.
The scale bar of (a) and (b) are 500nm.

(a)
(b)
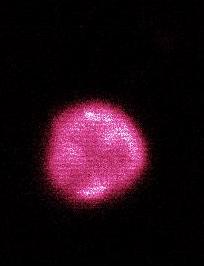
Fig.5 Confocal images of k562 cells.
Blank cell (a) and the cell (b) after the uptake of Tf-QDs. It is clear the cellular
fluorescent intensity increased significantly.
Tf conjugated onto QDs
should target the K562 cells that have the receptors for Tf expressed on their surface. It
is known that Tf has very high affinity and binding efficiency for its receptors (TfR) on
the membrane of carcinoma cell. The reason why the QDs were uptaken by cells was most
likely that the QDs were endocytosised and pinocytosised under the interactions between Tf
that coated on QDs and TfR on cell membrane. To demonstrate this presumption, we sought to
probe the intracellular structure by TEM and confocal microscopic images to further
demonstrate that the QDs were internalized into cells. Compared to the TEM image of blank
cells (Fig. 4 A), there are some represented nanoparticles were observed (Fig. 4B).
Simultaneously, after the cellular uptake of Tf-QDs, the cellular fluorescent intensity
increased dramatically (Fig 5A, Fig 5B), further revealing that the QDs were internalized
into cells. Importantly, these results were also consistent with previous report [11],
which demonstrated that the QDs were internalized into HeLa cells through specific
interaction between TfR and Tf that coated on QDs.
Interestingly, the uptake of Tf-QDs could be achieved by another
strategy. First, cells were cultured in the presence of pure Tf so that the TfRs on cell
surface could be preliminary activated and bound by Tf. And then streptavidin-QDs were
added to the culture well to further graft the biotin-Tf on cell surface. As expected,
similar large holes on cell surface were clearly observed as well (Fis3 A and B),
indicating that the QDs were internalized into cells as well. This should provide another
evidence to demonstrate that the uptake of QDs were mainly governed by specific receptor
inducement. This finding also suggested that the uptake of QDs could be achieved by
controlling the TfR activation. Therefore, we can conclude that the Tf-QDs are highly
specific and potent to the cellular receptor.
3.2 Biochemical significance of QDs uptake
Some groups [1-13] have studied the basic principle of QDs' application in biological labeling. However, the direct nanometer
scale visualizations of cell surface induced by endocytosis of ligand-conjugated QDs are
still missing today. It is worth to point out the importance of desired cellular
nanostructures that associated with the biological labeling by QDs. First, the elucidation
of cellular nanostructures by direct AFM visualizations of QDs uptake is especially
important for understanding cell characteristics and useful for designing and
interpretating molecular probes at nanometer scale. For example, the K562 cells after the
uptake of QDs were characterized by the significant holes on cell surface while the blank
cells maintain tight molecular connections. This result provides a direct evidence of
visualization for us to understand how and where the TfR transform outer molecules.
Secondly, at nanometer scale, much spatial prevention and nonspecific interactions make us
hard to detect the desired molecules on the complex cell surface directly. It seems that
we could use QDs fluorescent probes and AFM direct visualizations to study the cellular
nanostructures, which correlated with the functions of both the extracellular and
intracellular molecules and receptor-targeted cross membrane transportation. For example,
in our work, but for the AFM images and Tf-QDs, the functions of TfR on K562 cell membrane
were still can not be directly visualized by us. Therefore, the AFM visualizations
provided a background on the principles of cellular nanostructure analysis, making a case
for the use of such measurements as new methods for the cell biology. Further,
importantly, the high spatial and force resolution of AFM offer us the possibility to
observe the unique cellular nanostructures, which usually could not be achieved by
confocal microscopy and flow cytometry-based cellular fluorescence analysis. For example,
the cytoskeletal organization plays a crucial role in cellular proliferation, migration
and metabolism. Though it is apparent from the AFM images that some holes appeared on cell
surface, it is important to note that no significant cellular surface damage and
cytoskeleton disruptions were observed (Fig 2 B and Fig 3 B). Therefore, the cells should
maintain the physiological activities after the uptake of QDs, providing a nanometer scale
evidence to support that the QDs were not toxic to cells.
4. CONCLUSION
The AFM study, ultrasection images of TEM and the fluorescent images of confocal
microscope showed that the ligand-conjugated QDs are highly specific and potent to the
cellular surface receptor. QDs were endocytosised and pinocytosised under interactions
between Tf that coated on QDs and TfR on cell surface. This work should provide more
information in the application of QDs in biolabeling.
REFERENCES
[1] Wu X, Liu H, Liu J, Haley K N, Treadway J A, Larson J P, Ge N, Peale F, Bruchez M
P. Nat Biotechnol. 2003, 21 (1): 41.
[2] Jaiswal J K, Mattoussi H, Mauro J M, Simon S M. Nat Biotechnol. 2003, 21 (1): 47.
[3] Dahan M, Levi S, Luccardini C, Rostaing P, Riveau B, Triller A. Science. 2003, 302
(5644): 442.
[4] Lidke D S, Nagy P, Heintzmann R, Arndt-Jovin D J, Post J N, Grecco H E, Jares-Erijman
E A, Jovin T M. Nat Biotechnol. 2004, 22 (2): 198.
[5] Gao X, Cui Y, Levenson R M, Chung L W, Nie S. Nat Biotechnol. 2004, 22 (8): 969.
[6] Hoshino A, Hanaki K, Suzuki K, Yamamoto K. Biochem Biophys Res Commun. 2004, 314 (1):
46.
[7] Kaul Z, Yaguchi T, Kaul S C, Hirano T, Wadhwa R, Taira K. Cell Res. 2003, 13 (6): 503.
[8] Kloepfer J A, Mielke R E, Wong M S, Nealson K H, Stucky G, Nadeau J L. Appl Environ
Microbiol. 2003, 69 (7): 4205.
[9] Mansson A, Sundberg M, Balaz M, Bunk R, Nicholls I A, Omling P, Tagerud S, Montelius
L. Biochem Biophys Res Commun. 2004 F, 314 (2): 529.
[10] Mattheakis L C, Dias J M, Choi Y J, Gong J, Bruchez M P, Liu J, Wang E. Anal Biochem.
2004, 327 (2): 200.
[11] Chan WC, Nie S. Science. 1998, 281(5385): 2016.
[12] Fumio Osaki, Takuya Kanamori, Shinsuke Sando, Takashi Sera, and Yasuhiro Aoyama. J.
Am. Chem. Soc. 2004, 126 (21): 6520.
[13] Sandra J. Rosentha, Ian Tomlinson, Erika M. Adkins, Sally Schroeter, Scott Adams,
Laura Swafford, James McBride, Yongqiang Wang, Louis J. DeFelice, and Randy D. Blakely. J.
Am. Chem. Soc. 2002, 124(17): 4586.
[14] Chen Yong, Cai Jiye, Xu Qingcai, Zheng W. Chen, Molecular Immunology, 2004, 41 (12):
1247.
[15] ChenYong, Cai Jiye, Liu Meili, Zeng Gucheng, Feng Qian, Zheng W. Chen, Scanning,
2004, 26 (4): 155.
[16] Chen Yong, Cai Jiye, Zhao Tao, Wang Chenxi, Dong Shuo, Luo Shuqian, Zheng W. Chen,
Ultramicroscopy ,2005, (103): 175.
K562细胞吞噬量子点的原子力显微术可视化
曾谷城1 王 浩2,徐彦芳1,史金桃3,潘运龙1,3,蔡继业1
( 暨南大学 1化学系, 3 附属第一医院, 广州,510632; 2.华南师范大学光电子材料与技术研究所,广州,510632)
摘要 采用原子力显微镜观察K562细胞吞噬量子点以后细胞表面纳米结构的变化,并用透射电子显微镜进一步证实量子点进入了细胞。结果表明K562细胞对转铁蛋白耦连的量子点具有高度特异性。
关键词 量子点,原子力显微术,K562细胞,转铁蛋白