http://www.chemistrymag.org/cji/2005/078057pe.htm |
Aug. 30, 2005 Vol.7 No.8 P.57 Copyright |
The features of successive reactions and its application in kinetic analysis*
Wu Xinguo1, Cai Ruxiu2,
Lin Zhixin2
(1School of resources and environmental science, Wuhan
University, Wuhan 430079; 2School of chemistry and molecular science, Wuhan
University, Wuhan 430072, China)
Supported by the National Natural Science Foundation of China (Grant No: 20377032).
Abstract The potential of using
the kinetics of successive reactions in analytical chemistry was discussed based on the
theoretic analysis of the kinetic equations and the simulation studies of the kinetic
curves. The characters of successive reaction related to the reaction time and the
relative values of rate constants were presented. Special comments were given to the
situations that may be encountered in simultaneous kinetic determination based on
successive reactions. The kinetic equation based on detection reagent in the successive
reactions is given by us firstly.
Keywords successive reaction, kinetic analysis, analyte, intermediate, reagent.
Kinetic method is widely accepted in many areas[1-4]. These methods have the advantage of high sensitivity (catalytic and related kinetic determinations), high selectivity (initial rate method and simultaneous kinetic determination of binary or multicomponents without prior separation), easy to automate, simple, rapid and inexpensive. Up to date, most kinetic method are based on simple first order reactions, only recently the application of successive reactions kinetics in analytical chemistry was noticed by some researchers, and some methods, such as error compensated kinetic method[5-8], two-rate method[9-13] and time-pair method[14] based on successive reactions, were proposed. Some complex reactions that present in real analytical systems have also been studied[15]. Since there are two or more simple reactions involved in successive reactions, it can offer more information for kinetic analysis and more freedom to adjust the reaction to our needs. For example, there are more possibilities to increase the rate difference between two analytes based on successive reactions because two or more rate constants for one analyte can be regulated. Further more, due to the kinetic features of successive reactions are different from simple reactions, new kinetic methods may be proposed to exploit the kinetics with more advantages. Considering the above aspects, we studied the kinetic equations and curves resulted from detecting intermediate product, final product and reagent by using theoretic analysis and computer simulation. Some useful kinetic characters related to reaction time and the relative values of rate constants are concluded, a various situations that may be encountered in simultaneous kinetic determinations are discussed. It would give some guidance in real application.
1 THE KINETIC EQUATIONS OF
SUCCSSSIVE REACTIONS
Consider the following successive reactions:
A + m O ![]() B + m R
(1)
B + m R
(1)
B + n O ![]() C + n R
(2)
C + n R
(2)
where reactant A reacts with reagent O to give intermediate B, and B successively react
with O to give the final product C, in the process, reagent O converted to R. m, n accounts
for the stoichiometry of the two reactions respectively. In the case of far excess
amount of O, the two reactions are all pseudo-first order reactions, and k1, k2
are the two pseudo-first order rate constants. Different kinetic curves can be obtained by
detecting A, B, C, and R respectively, the kinetic equations of A, B, C are well known as
follows[16]:
[A]t = [A]0 e![]() (3)
(3)
[B]t = [A]0 ![]() (e
(e![]() - e
- e![]() )
(4)
)
(4)
[C]t = [A]0 [1 - ![]() (k2 e
(k2 e![]() - k1 e
- k1 e![]() )]
(5)
)]
(5)
From the fact that:
[R]t = m [B]t + (m + n)[C]t (6)
We deduced the kinetic equation of R:
[R]t = [A]0 [(m
+ n) + ![]() ] (7)
] (7)
where [A]0 is the
initial concentration of A. [A]t, [B]t, [C]t and [R]t
are the concentrations of A, B, C, R at time t respectively. If k1 = k2
= k then the equations of B, C, R are not defined, and will be replaced by:
[B]t = [A]0 k t e-kt
(8)
[C]t = [A]0 [1 - (1 + k t) e-kt]
(9)
[R]t = [A]0 {(m + n) - [(m + n) + n k t] e-kt}
(10)
The derivatives of kinetic
equations of B, C, R derived from time t give the rate equations of B, C, R:
rB = [A]0 ![]() ( k2
e
( k2
e![]() - k1 e
- k1 e![]() )
(11)
)
(11)
rC = [A]0 (e![]() - e
- e![]() )
(12)
)
(12)
rR = [A]0 ![]() {[(m + n)k2
- m k1]e
{[(m + n)k2
- m k1]e![]() - n k2 e
- n k2 e![]() } (13)
} (13)
Where rB, rC, rR are the rate of B, C, R at time t respectively. If k1 = k2 = k, then rate equations will be replaced by:
rB = [A]0 k (1 �Ck t) e -kt (14)
rC = [A]0 k2 t e-kt (15)
rR = [A]0 k (m + n k t) e-kt (16)
2 CHARACTERS RELATED TO THE
REACTION TIME
According to kinetic equations of concentration and reaction rate, via strictly
mathematical analysis, it can be predicted theoretically that during the time course of
successive reaction, the concentration of detected species and the reaction rate will
change in a manner different from simple reaction, it means that the shape of
concentration curve and rate curve will be different from simple reaction. The characters
can be described in 4 aspects: (1) rate at t = 0, (2) concentration at t = ��, (3) extremum of concentration, (4) extremum of rate. The
characters can be termed as time characters because they are associated with time. Table 1
summarizes the time characters of successive reactions detected by intermediate product,
final product and reagent, and compared with simple reactions. From these characters, we
can learn that whether or not a reaction we monitored is a successive reaction. For
example, the concentration maximum is present when detecting the intermediate product in
successive reactions, the initial rate is zero or an induction period is present when
detecting the final product in successive reactions, the equilibrium concentration is
amplified when detecting the reagent in successive reactions. These characters can be used
to develop new kinetic method. For example, time-pair method is developed based on the
peak-shaped kinetic curve when detecting the intermediate product in successive reactions[14],
which can be used for selective kinetic determination or simultaneous kinetic
determination; two-rate is developed to exploit the rate difference in the starting phase
and the terminal phase of successive reactions[9-13].
Table1 Time character of successive reactions and simple reaction
Reaction type |
Simple reaction |
Successive reactions |
||
Detection species |
A |
B |
C |
R |
Initial rate |
k1 [A] 0 |
k1 [A] 0 |
0 |
m k1 [A] 0 |
Equilibrium concentration |
0 |
0 |
[A] 0 |
(m + n) [A] 0 |
Concentration extremum |
None |
Maximum at t= (ln(k1 /k2))/(k1-k2) |
None |
None |
Rate extremum |
None |
Minimum at t= 2 (ln(k1 /k2))/(k1-k2) |
Maximum at t = (ln(k1 /k2))/(k1-k2) |
Maximum at
t = |
3 EFFECTS OF THE RELATIVE VALUE OF
RATE CONSTANTS ON THE KINETIC CURVES
The kinetic equations of successive reactions are defined by two rate constants k1
and k2, but the overall reaction is not a simple mathematical addition of two
simple reactions. The contribution of two simple reactions to the successive reaction is
decided by the relative value of k1 and k2. Let r = k2/k1,
then the kinetic equation of B, C, R will be:
[B]t = [A]0 (e![]() - e
- e![]() ) /(r-1)
(17)
) /(r-1)
(17)
[C]t = [A]0 [1 -
(r e![]() - e
- e![]() )/(r-1)]
(18)
)/(r-1)]
(18)
[R]t = [A]0 [(m
+ n)(r - 1) + ( m - (m + n) r)e![]() + n e
+ n e![]() ]/(r-1)
(19)
]/(r-1)
(19)
As can be seen,
the coefficients of powered term are defined only by r, and have no relationship with the
absolute value of k1 and k2. In order to study the effects of r on
the kinetic curves of successive reaction, we simulated a series of kinetic curves of
concentration and rate at different r value. The r value is changed by fixing k1
and changing the value of k2.
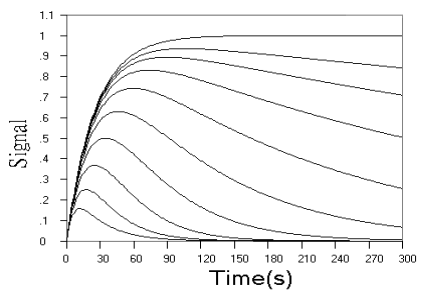
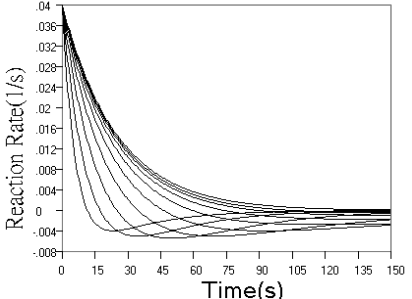
Fig.1 Simulated concentration (upper panel) and rate (lower panel) curves
based on detecting intermediate product in successive reactions. In each panel from ground
to top, k1 = 0.04 s-1, k2 = 0.16, 0.08, 0.04, 0.02, 0.01,
0.005, 0.0025, 0.00125, 0.000625, 0 s-1 respectively.
Fig.1 shows the kinetic curves of concentration and rate for detection
of the intermediate product in successive reaction. As can be seen from the concentration
curves in Fig.1, the maximum concentration of intermediate product decreased, and the time
need to reach the maximum reduced, when r value increased. When r value decreased, the
starting phase of the kinetic curve overlapped more and more, and the maximum
concentration of intermediate product approached the initial concentration of analyte more
and more closely, and the time need to reach the maximum approached the end point of the
first step reaction more and more closely. The rate curves of Fig.1 reflect these changes
more sensitively. When r increased, the reaction rate in starting phase decreased to a
minimum almost linearly with time, and when r decreased, the overlapped part of the rate
curve in starting phase increased more and more, indicating that the effect of k2
on the reaction is smaller and smaller.
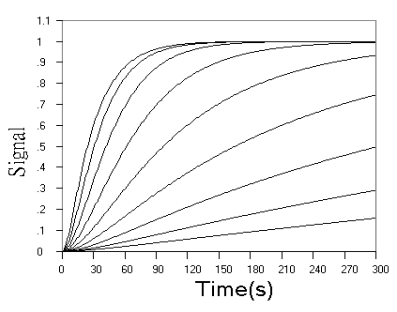
Fig.2 Simulated concentration (upper panel) and rate (lower panel) curves based
on detecting final product in successive reactions. In upper panel from top to ground, k1
= 0.04 s-1, k2 = 0.16, 0.08, 0.04, 0.02, 0.01, 0.005, 0.0025,
0.00125, 0.000625, 0 s-1 respectively. In lower panel from top to ground, k1
= 0.04 s-1, k2 = 2.56, 1.28, 0.64, 0.32, 0.16, 0.08, 0.04, 0.02,
0.01, 0.005 s-1 respectively.
Fig.2 shows the
concentration and rate kinetic curves for detection of the final product in successive
reactions. When r value increased, the difference between kinetic curves turned to be
smaller and smaller, and approached a limit of the simple first step reaction kinetics, as
can be seen from the concentration curves in Fig.2 and further confirmed by the rate
curves in Fig.2. From rate curves in Fig.2, the changes in the starting phase of the
kinetic curves can be seen more clearly. When r value decreased, the overall reaction
turned to be determined by the second step reaction, When r increased, the reaction rate
increased from zero to a maximum almost linearly with time.
Fig.3 shows the concentration and rate kinetic curves for
detection of the reagent in successive reactions. As can be seen from the concentration
curves in Fig.3, when r value increased, the kinetic curves turned to approach a limit of
the simple first step reaction kinetics, but the sensitivity is doubled, When r value
decreased, the starting phase of the kinetic curve turned to be overlapped with simple
first step reaction, and the terminal phase of the reaction is almost determined by second
step reaction. These observations are further confirmed more clearly by rate curves in
Fig.3. Another finding from rate curves in Fig.3 is that when r increased above a value,
the rate maximum occurs and approaches the limit of (m + n)[A0] k1.
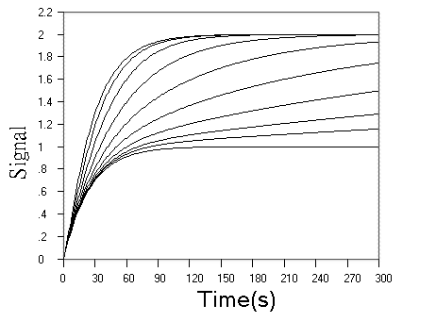
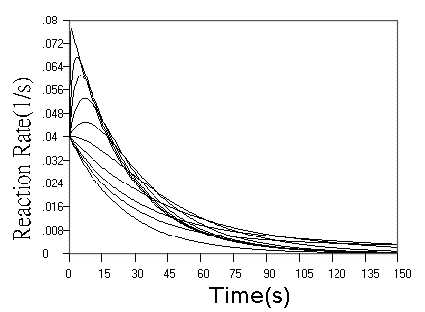
Fig.3 Simulated concentration (upper panel) and rate (lower panel) curves
based on detecting reagent in successive reactions. In the two panel, m = n = 1, k1
= 0.04 s-1. In upper panel from top to ground, k2 = 0.16, 0.08,
0.04, 0.02, 0.01, 0.005, 0.0025, 0.00125, 0.000625, 0 s-1 respectively. In
lower panel from top to ground, k2 = 5.12, 0.64, 0.32, 0.16, 0.08, 0.04, 0.02,
0.01, 0.005,0 s-1 respectively.
Some important results obtained by simulation studies
and theoretical analyses are summarized in Table2. These results can offer guidelines for
us to control a proper r value to increase the kinetic difference between analytes, and
help us evaluate the exploitation value of successive reactions in analytical chemistry.
When nonlinear least square method was applied to obtain concentrations and rate
constants, good initial estimates of these parameters can be obtained by disposal of
approximated kinetic equations in Table2. From simulation studies, we can learn that the
overall kinetic behaviour is determined by r value only. Only a limited range,
approximately from 1/16 to 16, is allowed for r value to maintain the real successive
reactions. We can exloit this property to enlarge the kinetic difference between analytes
by control the r value.
Table2 Effects of relative value of rate constants on successive reactions
Curve |
r value |
Effects |
B |
r ��
�� |
Impossible to detect B |
r �� 0 |
1. Starting phase
approximated as [B]t = [A]0(1- e 2. Terminal phase approximated as [B]t = [A]0 e |
|
Middle |
1.Starting phase approximated
as [B]t = [A]0k1(t- (k1 + k2)t2/2) 2. Terminal phase approximated as [B]t = [A]0 e when k2 > k1, or [B]t = [A]0 e |
|
C |
r ��
�� |
Kinetic
curve approximated as [C]t = [A]0(1- e |
r �� 0 |
Kinetic
curve approximated as [C]t = [A]0(1- e |
|
Middle |
1. Starting phase
approximated as [C]t = [A]0k1k2t2/2 2. Terminal phase approximated as [C]t = [A]0 (1- r e when k2 > k1, or [C]t = [A]0 (1- e |
|
R |
r ��
�� |
Kinetic
curve approximated as [R]t = (m + n)[A]0(1- e |
r �� 0 |
1.Starting phase approximated
as [R]t = m [A]0(1- e 2.Terminal phase approximated as [R]t = [A]0 ((m + n)-n e |
|
Middle |
1. Starting phase
approximated as [R]t = [A]0k1 {m t + ( m k1
�C ( m + n) k2 + n k2) t2/[2(r-1)]} 2. Terminal phase approximated as [R]t = [A]0 ((m + n) + e when k2 > k1, or [R]t = [A]0 ((m + n) + n e |
4 THE SITUATIONS MAY
BE ENCOUNTERED IN KINETIC ANALYSIS BASED ON SUCCESSIVE REACTIONS
According to the effects of r
value on the kinetic curves of successive reactions, we can propose various situations
that may be encountered in real analysis. It is nessary to evaluate which situation is
favourable to analysis and what is unfavourable, as it can guide us select proper
experiment conditions to control the right r value, and perform selective or simultaneous
determinations.
Consider binary mixtures of A and A', the rate constants in successive
reactions of A and A' are k1, k2 and k1' and k2' respectively. Nine situations may be encountered in real
analysis and they are summarized in Table3. The most unfavourable situation is No.1,
because it is impossible to detect B, and the exploitable rate constants for detecting C
and R is only k1 and k1', k2 and k2' lose its present value. In this situation, the
successive reaction of C and R is in fact degenerated to simple reaction. The unfavourable
situation is No.4, the successive reaction for detecting B and R degenerated to two
separated simple reactions, for detecting C, it degenerated to simple reaction. The less
favourable situation is No.9, the r value remains in successive region for both analytes.
The most favourable situation is that, one analyte has a r value remain in the successive
reaction region, while another analyte has a r value out of the range, such as
No.2,3,5,6,7,8 etc.. In these situations, the kinetic difference between two analytes can
be enlarged due to the presence of the second step reaction in the successive reactions.
Table3 Situations may be
encountered in kinetic analysis based on successive reactions
No. |
Rate constants character |
Detection species |
||
B |
C |
R |
||
1 |
k2 >> k1 k2' >> k1' |
Impossible to detect B |
Exploit the difference of k1 and k1' |
Exploit the difference of k1 and k1' |
2 |
k2 >> k1 k2' �� k1' |
Selectively determinate of A' |
The presence of k2' increase the kinetic difference of k1 and k1' |
The presence of k2' increase the kinetic difference of k1 and k1' |
3 |
k2 >> k1 k2' << k1' |
Selectively determinate of A' |
Exploit the difference of k1 and k2' |
The presence of k2' increase the kinetic difference of k1 and k1' |
4 |
k2 << k1 k2' << k1' |
Exploit the difference of k1 k2 and k1' k2' |
Exploit the difference of k2 and k2' |
Exploit the difference of k1 k2 and k1' k2' |
5 |
k2 << k1 k2' �� k1' |
Exploit the difference of k1 k2 and k1' k2' |
The presence of k1' increase the kinetic difference of k2 and k2' |
Exploit the difference of k1 k2 and k1' k2' |
6 |
k2 << k1 k2' >> k1' |
Selectively determinate of A |
Exploit the difference of k1' and k2 |
The presence of k2 increase the kinetic difference of k1 and k1' |
7 |
k2 �� k1 k2' >> k1' |
Selectively determinate of A |
The presence of k2 increase the kinetic difference of k1 and k1' |
The presence of k2 increase the kinetic difference of k1 and k1' |
8 |
k2 �� k1 k2' << k1' |
Exploit the difference of k1 k2 and k1' k2' |
The presence of k1 increase the kinetic difference of k2 and k2' |
Exploit the difference of k1 k2 and k1' k2' |
9 |
k2 �� k1 k2' �� k1' |
Exploit the difference of k1 k2 and k1' k2' |
Exploit the difference of k1 k2 and k1' k2' |
Exploit the difference of k1 k2 and k1' k2' |
5 CONCLUSION
Through theoretical analysis and simulation studies, we learnt that successive
reaction have different characters from simple reaction, such as: there is a concentration
maximum when detecting the intermediate product in successive reactions, there is an
induction period when detecting the final product in successive reactions, the equilibrium
concentration is amplified when detecting the reagent in successive reactions etc.. The
relative value of rate constants in successive reactions has a decisive influence on the
kinetic behaviour, for example, when r is large, the detection of B is impossible, C and R
degenerate to simple reaction defined by k1; when r is small, C degenerate to
simple reaction defined by k2, B and R degenerate to two separate step simple
reactions. From these results, we can select proper experiment conditions to maintain a
proper r value, so as to enlarge the kinetic difference between two analytes, when perform
simultaneous kinetic determinations based on successive reactions.
REFERENCES
[1] Mottola H A. Kinetic Aspects of Analytical Chemistry, New York: Wiley, 1988.
[2] Perez-Bendito D, Silva M. Kinetic Methods in Analytical Chemistry, Chichester:
Horwood, 1988.
[3] Pardue H L. Anal. Chim. Acta, 1989, 216: 69.
[4] Crouch S R, Scheeline A, Kirkor E S. Anal. Chem., 2000, 72: 53R.
[5] Schechter I. Anal. Chem., 1991, 63: 1303.
[6] Gui M, Rutan S C. Anal. Chem., 1994, 66: 1513.
[7] Cai R X, Wu X G, Liu Z H et al. Analyst, 1999: 124, 751.
[8] Wu X G, Cai R X. Analyst, 2001, 126: 690.
[9] Hsieh Y S, Crouch S R. Anal. Chim. Acta, 1994, 296: 333.
[10 ] Wu X G, Cai R X, Lin Z X et al. Chem. J. Chinese
Universities(Gaodeng Xuexiao Huaxue Xuebao), 1995, 16: 1868.
[11] Wu X G, Cai R X, Lin Z X et al. Acta. Chim. Sin.(Huaxue Xuebao), 1995, 53: 1198.
[12] Wu X G, Cai R X, Zhang L et al. Anal. Chim. Acta, 2001, 448: 257.
[13] Wu X G, Cai R X. Anal. Chim. Acta, 2002,464: 153.
[14] Wu X G, Cai R X, Lin Z X et al. Anal. Chim. Acta, 1996, 325: 105.
[15] Laios I D, Pardue H L. Anal. Chem. 1993, 65: 1903.
[16] Espenson J H. Chemical Kinetics and Reaction Mechanisms, New York: McGraw-Hill, 1981.
��
������Ӧ�����Լ����ڶ���ѧ�����е�Ӧ��
���¹�1��������2��������2
(1�人��ѧ��Դ�뻷����ѧѧԺ�������人��430079; 2�人��ѧ��ѧ����ӿ�ѧѧԺ�������人��430072)
ժҪ ͨ����������Ӧ����ѧ���̵����۷����Ͷ���ѧ���ߵ�ģ���о���������������Ӧ��ʱ������ʳ������ֵ�仯��������������������Ӧ�ڷ�����ѧ��Ӧ�õĿ����ԣ�������������Ӧ���ж���ѧͬʱ�ⶨ���������ļ���������ؽ��������������л��ڼ���Լ���������Ӧ����ѧ�����������ڹ��������������
�ؼ��� ������Ӧ������ѧ������������м���Լ�
��