http://www.chemistrymag.org/cji/2005/079059pe.htm |
Sep. 22, 2005 Vol.7 No.9 P.59 Copyright |
Li
Zhengping, Feng Cui
(College of Chemistry and Environmental Science, Hebei University, Baoding 071002)
Abstract Ferric hydroxide nanoparticle solution, often referred to as "ferric colloid", is widely utilized in biotechnological systems and has attracted great scientific interest. In this paper, it was found that the ferric hydroxide nanoparticle had great catalytic effect on the chemiluminescent (CL) reaction of luminol-H2O2 system. The mechanism of the CL was explored and the results showed that the CL was originated from the catalysis of ferric ions on the surface of ferric hydroxide nanoparticles. It was also found that under the optimum conditions, the CL intensity was proportional to the amount of ferric hydroxide nanoparticles. Based on the phenomena, a sensitive CL method was established to detect ferric hydroxide nanoparticles directly. Thus the proposed CL method shows significant potential for the application of ferric colloid in biochemistry.
Keywords chemiluminescence, ferric hydroxide nanoparticle, luminol 1 INTRODUCTION
Ferric hydroxide nanoparticles were one of the most widely used nanomaterials in biotechnological system. In the pH range of 1.6- 7.6, ferric colloid carry a positive charge, and gives a distinct Prussian blue reaction. It can be used for the detection of anionic groups of acid mucopolysaccharides and proteins by light microscopy. It is also useful for detecting the exact sites of ionized anionic groups in deep tissue areas using electron microscopy. [1,2]
Traditionally, the methods of detecting nanoparticles were spectrophotometry and Transmission Electron Microscope (TEM), but the former is less sensitive and the latter is expensive in instruments. In comparison with traditional determination methods, the chemiluminescence (CL) analysis is rapid, sensitive with low detection limits and does not require expensive instruments.
Since the CL phenomenon of luminol was first reported by Albrecht in 1928 [3], investigation of effective catalysts for such CL reactions has been carried out, including metal ions, metal complex, and enzymes [4-12]. However, the application about nanoparticles as catalysts for the luminol CL system has not yet been reported.
Luminol-H2O2 CL reaction has been widely applied for the detection of various substances[13-19]. In this work, we chose the luminol-H2O2 CL reaction as a model system and explored the catalytic effect of colloidal solution of ferric hydroxide nanoparticles on the CL. It was found that ferric hydroxide nanoparticles could enhance the CL from the Luminol–H2O2 system. The enhancement mechanism of ferric hydroxide nanoparticles on luminol CL was investigated. The quantitative CL analysis for ferric hydroxide nanoparticles was exploited. 2 EXPERIMENTAL
2.1 Instruments
All CL measurements were made with a BPCL model Ultra-Weak Luminescence Analyzer (Institute of Biophysics Academia Sinica, Beijing, China). All pH measurements were taken with a pHS-3C pH meter (Shanghai, China).
2.2 Reagents
A 2.5×10⁻² mol/L stock solution of luminol (3-aminophthalhydrazide, Shanxi Normal University, Xi'an, China) was prepared by dissolving luminol in 0.1 mol/L sodium hydroxide solution. Working solutions of luminol were prepared by diluting the stock solution. Sodium cacodylate (AMRESCO Co.) solution (0.1 mol/L) was prepared by dissolving 2.14 g sodium cacodylate in 100 mL water. All other reagents were of analytical grade without further purification, and doubly de-ionized water was used throughout.
2.3 Synthesis of ferric hydroxide nanoparticles
A colloidal solution of ferric hydroxide nanoparticles was synthesized by dropping 10 mL FeCl3 solution (1.67×10⁻² g/mL, calculated with Fe) in 90 mL boiling water with stirring and then naturally cooled to room temperature. The colloidal solution was mixed with 0.1 mol/L sodium cacodylate solution in proportion of 1:10 and adjust the pH value of the solution to 7.4 by 1.0 mol/L HCl. The ferric hydroxide nanoparticles were characterized by a JEM–100SX transmission electron microscope (TEM, Tokyo, Japan). The TEM image shows that the diameters of nanoparticles are about 10 nm [20].
2.4 Procedure
The working solution of ferric colloid was obtained by serial dilutions of prepared ferric colloid with 0.01 mol/L sodium cacodylate solution (pH 7.4). 100 mL of this working solution was transferred into a quartz CL reaction tube using a pipette, then, 200 mL of the CL reagent was injected by a quantitative injector and the CL intensity–time profiles were measured and recorded immediately. The CL signal intensity was recorded by BPCL software and calculated by peak height.
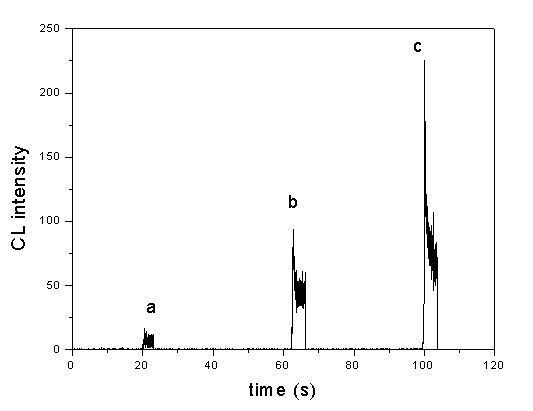
Fig. 1 Dynamic curves of CL reaction: (a) Sodium cacodylate solution, (b) Fe(OH)3 nanoparticle + sodium cacodylate solution, (c) Fe(III) + sodium cacodylate solution. Conditions: luminol, 5×10⁻³ mol/L in NaOH solution (pH 12.3); H2O2, 5×10⁻² mol/L; sodium cacodylate solution, 0.01 mol/L (pH 7.4); Fe(OH)3 nanoparticle and Fe(III) ion solution, 1.67×10⁻⁶ g/mL.
3 RESULTS AND DISCUSSION
3.1 Chemiluminescence dynamic curves
The CL intensity–time profiles for 1.67×10⁻⁶
g/mL ferric colloid solution (calculated with Fe) and 1.67×10⁻⁶ g/mL Fe(III)
ion (both adjusted to pH 7.4 by 0.01 mol/L sodium cacodylate solution) was obtained, as
shown in Fig. 1. The reaction of luminol with hydrogen peroxide in alkaline solution in
the absence of a catalyst underwent weak CL, but with the addition of Fe(OH)3
nanoparticles and Fe(III) ions, the CL signals could be enhanced greatly. Besides, Fe(OH)3
nanoparticles and Fe(III) ions have the same CL dynamic curves (their CL intensities both
reach the maximum values within 0.7 s, and decay quickly ). But at the same concentration,
Fe(OH)3 nanoparticles had a lower catalytic effect on this CL reaction. It is
indicated that the catalytic mechanism of Fe(OH)3 nanoparticle on luminol–H2O2 CL reaction is the same as that of
Fe(III) ion, namely, the catalytic effect of Fe(OH)3 nanoparticles to the CL
reaction was originated from the Fe(III) ions on the surface of the nanoparticles.
3.2 Optimization of the reagent condition
3.2.1 Effect of concentration of luminol and H2O2 on the CL
intensity
To investigate the effect of concentration of luminol and H2O2
on the CL intensity of Fe(OH)3 nanoparticles, the CL intensities of 1.67×10⁻⁶
g/mL ferric colloid solution were measured with various concentrations of luminol and H2O2
by using 0.01 mol/L sodium cacodylate solution as the blank. The result was
shown in Fig. 2, where the blank signal had been subtracted for each value of CL
intensity. From Fig. 2, it can be seen that the CL intensity increases with increasing
concentration of luminol until luminol concentration is 5×10⁻³ mol/L. When
luminol concentration is 1×10⁻² mol/L, the maximum CL intensity is almost the
same as that with 5×10⁻³ mol/L luminol. On the other hand, although the CL
intensity of Fe(OH)3 nanoparticles with 5×10⁻⁴ mol/L luminol was
much lower than that with 5×10⁻³ mol/L luminol, the CL intensity ratio of
Fe(OH)3 nanoparticles to the blank with 5×10⁻⁴ mol/L luminol was
similar to that with 5×10⁻³
mol/L luminol. As well known, the CL analysis
sensitivity depends on the CL intensity ratio of sample to blank when the CL signal has
enough intensity. Therefore, both 5×10⁻⁴ mol/L luminol and 5×10⁻³ mol/L luminol
were used for the subsequent work. Moreover, when the luminol concentration is either 5×10⁻⁴
mol/L or 5×10⁻³ mol/L, the CL intensity all reaches a maximum value when the
concentration ratio of H2O2 to luminol is at 1:10. So 5×10⁻³
mol/L and 5×10⁻² mol/L H2O2 were chosen as being optimum
for using 5×10⁻⁴ mol/L or 5×10⁻³ mol/L luminol, respectively.
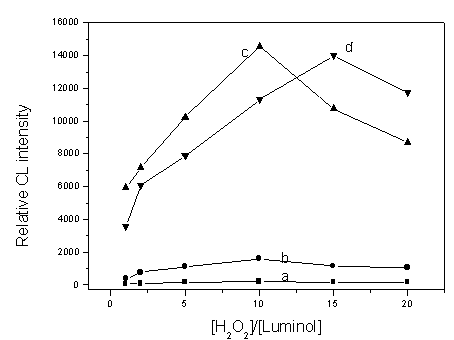
Fig. 2 Effect of luminol and H2O2 concentration on CL
intensity: (a), (b), (c) and (d) represent the lumimol concentration of 5×10⁻⁴,
1×10⁻³, 5×10⁻³, 1×10⁻² mol/L, respectively.
3.2.2 Influence of buffer medium and
pH value of CL reagent on the CL intensity
The buffer medium and pH value of luminol–H2O2
CL reagent play a very important role in CL analysis. The Britton–Robinson buffer solution was first used to adjust the pH value of
the CL reagent, the results were shown in Fig. 3 (A). As shown in it, in Britton–Robinson (B-R) buffer solution, when the pH value was below 10 or
above 12, the CL signals have little differences between blank and sample, but in the pH
range of 10.5 ~ 11.5, the CL intensity of blank increased slowly while that of the sample
increased sharply. Therefore, in the following experiments alkaline buffer solutions such
as Na2CO3-NaHCO3, Na2HPO4–NaOH, and NaOH were chosen respectively to adjust the pH value of
the CL reagent further. From Fig. 3 (B, C, D), we can see clearly that the optimal buffer
solution was found to be NaOH buffer solution. In NaOH buffer solution, the CL reagent pH
was studied over the pH range from 11.1 to 12.3 when 5×10⁻⁴ mol/L luminol–5×10⁻³ mol/L H2O2 was used as the
CL reagent. As shown in Fig. 3 (D), both CL intensity of Fe(OH)3 nanoparticles
and the CL intensity ratio of Fe(OH)3 nanoparticles to the blank reach their
maximum value at pH 11.3.
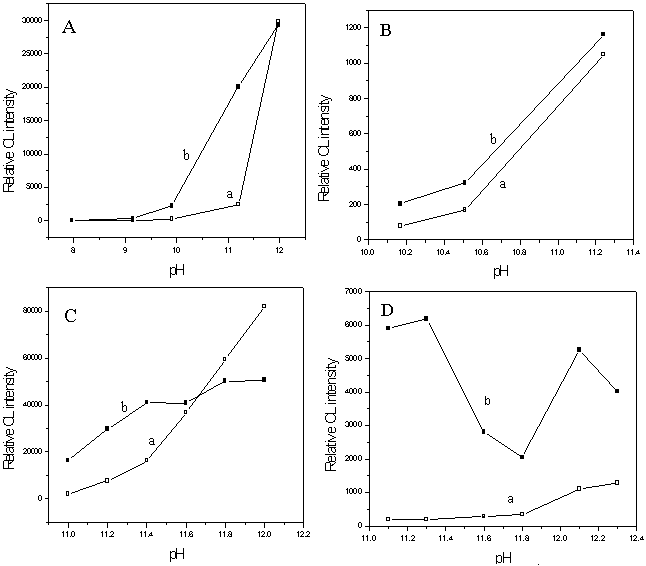
Figure 4 shows the influence of pH value of CL reagent on the CL intensity of Fe(OH)3 nanoparticles when 5×10⁻³ mol/L luminol–5×10⁻² mol/L H2O2 was used as the CL reagent. From Fig. 4, it can be seen that the blank CL intensity increased with increasing pH value until pH 12.9, and Fe(OH)3 nanoparticles had a maximum CL intensity when pH is at 12.6. However, the CL intensity ratio of Fe(OH)3 nanoparticles to the blank was maximum at pH 12.3. Therefore, the CL reagents of 5×10⁻⁴ mol/L luminol - 5×10⁻³ mol/L H2O2 and 5×10⁻³ mol/L luminol - 5×10⁻² mol/L H2O2 were adjusted to pH 11.3 and pH 12.3 by NaOH for the subsequent work, respectively.
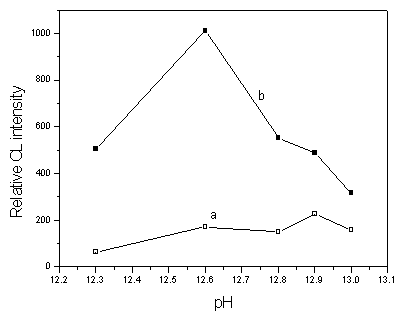
Fig. 4 Effect of pH on CL intensity: (a) Sodium cacodylate solution, (b) Fe(OH)3 nanoparticle. Conditions: Fe(OH)3 nanoparticle, 1.67×10⁻⁶ g/mL; sodium cacodylate solution, 0.01 mol/L (pH 7.4); luminol, 5×10⁻³ mol/L; H2O2, 5×10⁻² mol/L.
4 THE LINEAR RANGE AND DETECTION LIMITS
Under the optimum conditions selected above, an investigation of the relationship
between Fe(OH)3 nanoparticle concentrations and CL intensity was carried out by
using 5×10⁻⁴ mol/L luminol–5×10⁻³
mol/L H2O2 and 5×10⁻³ mol/L luminol–5×10⁻² mol/L H2O2 as the CL
reagent, respectively. As shown in Fig. 5 (A), for 5×10⁻⁴ mol/L luminol–5×10⁻³ mol/L H2O2, the
calibration curve gave the equation of best fit of ICL = -40.5+1.35×10⁹C
(R=0.9947), the calibration functions for the analyte approximated linearity in the
concentration range from 5×10⁻⁸ to 1×10⁻⁵ g/mL, the detection
limit (3s) is 2×10⁻⁸
g/mL. And for 5×10⁻³ mol/L luminol–5×10⁻²
mol/L H2O2 [shown in Fig. 5 (B)], the linear regression equation of
the calibration curve is ICL = -26.4+1.84×10⁹C
(R=0.9850) in the linear range from 2×10⁻⁸ to 5×10⁻⁷ g/mL, and the
detection limit is 6×10⁻⁹ g/mL.
As can be seen from Fig. 5, when the CL reagent was used at lower
concentration (5×10⁻⁴ mol/L luminol–5×10⁻³
mol/L H2O2), there are wide linear range and good linear
relationship for the CL detection method of Fe(OH)3 nanoparticles. By using
higher concentration of CL reagent (5×10⁻³ mol/L luminol–5×10⁻² mol/L H2O2), the higher
sensitivity and lower detection limit can be obtained.
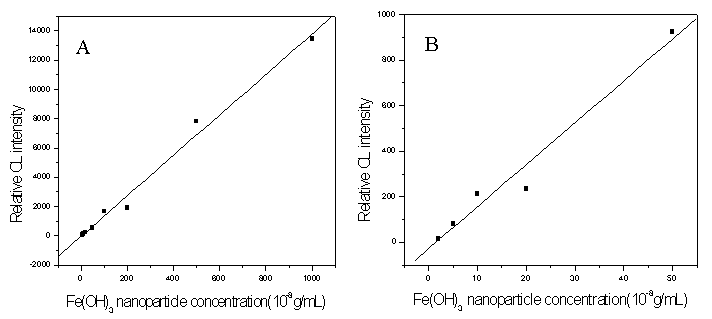
Fig. 5 Standard curves: (A) 5×10⁻⁴ mol/L luminol–5×10⁻³ mol/L H2O2, (B) 5×10⁻³
mol/L luminol–5×10⁻² mol/L H2O2
5 CONCLUSION
In this paper, it was found that Fe(OH)3 nanoparticles can greatly enhance the
CL intensity of luminol–H2O2
system. The CL enhancement by Fe(OH)3 nanoparticles was suggested to be due to
the catalytic effect of ferric ions on the nanoparticle surface to the luminol–H2O2 CL reaction. The sensitive CL method for
Fe(OH)3 nanoparticle determination was accordingly established with a simple CL
analyzer.
Ferric colloid has been widely used for the detection of anionic sites
on cell surface and the immunohistochemical detection of cellular antigens by Prussian
blue reaction for light microscopy or for electron microscopy. [1,21] As the
rapid development of CL image technology, the proposed CL method of nanoparticle
determination may be very advantageous to the sensitive immunohistochemical detection with
simple CL image.
Moreover, Ferric colloid nanoparticles is very easy to prepare in
laboratory. It was proved that the biochemical activities of various antibodies would not
be affected when coupling the antibodies to ferric colloid nanoparticles [21,22].
Therefore, the CL detection method shows significant potential for the CL immunoassay by
labeling ferric nanoparticles.
Acknowledgement The project was supported by the National Natural Science Foundation of China (NSFC, No.20375011) and the National Science Foundation of Hebei Province (No.203111).
REFERENCES
[1] Seno S, Akita M, Ono T et al. Histochemistry, 1985, 82: 307.
[2] Murakami T, Taguchi T, Ohtsuka A et al. Arch Histol Jap, 1986, 49 (1): 12.
[3] Albrecht H O Z. Phys. Chem., 1928, 136: 321.
[4] Schneider E. J. Am. Chem. Soc., 1941, 63: 1477.
[5] Shevlin P B, Neufeld H A. J. Org. Chem., 1970, 35: 2178.
[6] Bostick D T, Herclues D M. Anal. Chem., 1975, 47: 447.
[7] White E H, Bursey M M. J. Chem. Soc., 1964, 86: 941.
[8] Merényi G., Lind J S. J. Am. Chem. Soc., 1980, 102: 5830.
[9] Easton P M, Simmonds A C, Rakishev A et al. J. Am. Chem. Soc., 1996, 118: 6619.
[10] Kricka L J, Voyta J C, Bronstein, Methods Enzymol., 2000, 305: 370.
[11] Liu Y M, Cheng J K. J.Chromatogr., A 2002, 959: 1.
[12] Yeh H C, Lin W Y. Talanta, 2003, 59: 1029.
[13] Niazov T, Pavlov V, Xiao Y et al. Nano Lett. 2004, 4: 1683.
[14] Pavlov V, Xiao Y, Gill R et al. Anal. Chem., 2004, 76: 2152.
[15] Dapkevicius A, Van Beek T A, Niederlander H A G et al. Anal. Chem., 1999,71: 736.
[16] Parejo I, Viladomat F, Bastida J et al. J. Agric. Food Chem., 2004, 52: 1890.
[17] Wang J, Huang W, Liu Y et al. J. Anal. Chem., 2004, 76: 5393.
[18] Tsukagoshi K, Nakahama K, Nakajima R. Anal. Chem., 2004, 76: 4410.
[19] Liu B F, Ozaki M, Utsumi Y et al. Anal. Chem., 2003, 75: 36.
[20] Li Z P, Wang Y C, Zhang W W et al. Chemical Journal on Internet, 2004, 6 (11): 81.
[21] Seno S, Akita M, Hsueh C L. Histochemistry, 1989, 91: 449.
[22] Seno S, Tsujii T, Ono T et al. Histochemistry, 1983, 78: 27.
李正平,冯翠
(保定河北大学化学与环境科学学院,071002)
摘要 氢氧化铁纳米粒子溶液,通常称作“胶体铁”,它在生物技术中广泛应用并已经引起很多科学家的兴趣。本文研究发现,氢氧化铁纳米粒子对鲁米诺–双氧水化学发光反应有很好的催化作用。对该体系反应机理研究表明,化学发光可能产生于氢氧化铁纳米粒子表面的铁离子对鲁米诺–双氧水体系的催化作用,并发现在最佳反应条件下,化学发光信号与氢氧化铁纳米粒子的量成正比,基于这种现象,建立了一种灵敏的直接检测氢氧化铁纳米粒子的方法。这种方法可能为氢氧化铁纳米粒子在生化分析中开辟新的应用前景。
关键词 化学发光,氢氧化铁纳米粒子,鲁米诺