http://www.chemistrymag.org/cji/2005/07a066pe.htm |
Oct. 2, 2005 Vol.7 No.10 P.66 Copyright |
Li
Zhengping, Liu Wei, Zheng Chao, Xu Wenjie
(College of Chemistry and Environmental Science, Hebei University, Baoding 071002)
Abstract Chromium hydroxide nanoparticles have been prepared by forced
hydrolysis method and used as a new kind of resonance light scattering (RLS) probe for the
quantitative analysis of proteins. At pH 5.9, the interaction between chromium hydroxide
nanoparticles and proteins results in great enhancement of RLS signals in the wavelength
range from 250 to 700 nm characterized by the peak around 341 nm. Based on this, a
sensitive method for protein determination is established. The linear range of the
calibration curve is 0.08 -1.6 mg/mL and the detection limit (3s) is 18.6 ng/mL for bovine serum albumin (BSA). The RLS
method exhibits lower variation in response signal for the same weight of BSA, human serum
albumin (HSA) and g-globulin (g-G) and has been successfully applied to the determination
of the total protein in human serum samples. The result is coincident with that of the
Coomassie Bright Blue (CBB) method, which indicates that the proposed method here is very
simple, sensitive and reliable. As a new RLS method, it also shows significant potential
for the determination of biotical analytes by using nanoparticles as probes.
Keywords chromium hydroxide
nanoparticles, bovine serum albumin (BSA), resonance light scattering (RLS)
1. INTRODUCTION
The determination of proteins is a vital problem in molecular biology, biochemistry
and clinical diagnosis. The standard methods for protein determination are the Lowry
[1] and the Bradford [2] assays. The basis of these methods is color
variation of the dyes after binding to proteins. However, their disadvantages are low
sensitivity and complicated procedures. Afterwards, researchers have put forward many new
methods such as colloidal gold and colloidal silver staining [3],
fluorescence assays [4] and chemiluminescence methods [5].
Since Pasternack et al. [6] applied the resonance light
scattering (RLS) technique to study the aggregation of porphyrin and chlorophyll, this
technique has gradually drawn many researchers' attention
because of high sensitivity and operational simplicity. Huang et al. [7] found
that RLS signals of some dyes were strongly enhanced after adding nucleic acids, and they
firstly set up the RLS method for DNA assay by using a common spectrofluorometer. As a new
spectral analysis technique, the RLS technique has been widely used to quantitatively
determine proteins [8, 9] in aqueous solution in view of the enhanced RLS
signals. However, all the RLS assays are based on the interaction between proteins and
organic dyes [9, 10].
Recently, the nanoparticles have begun to receive more and more
attention as the light scattering probes due to their excellent physical and chemical
characteristics. Light scattering nanoparticles can be characterized with great advantages
for several reasons: firstly, the nanoparticles have high light scattering powers, which
allows these particles to be easily detected; secondly, compared with organic dyes, the
nanoparticles are generally easy to prepare, low cost and nonpoisonous; thirdly, proteins,
DNA probes and other biological molecules can be readily attached to the nanoparticles
without altering their biological activity. Zhu et al. have established the light
scattering method for determination of proteins by their quenching effect on large
particle scattering of colloidal silver chloride [11]. The functionalized HgS
nanoparticles have also applied to determine g-globulin at nanogram level by its enhancement effect on the RLS [12].
However, the response signals of proteins were all obtained by compared with the high
background in the quenching method, and the background was very high and the response RLS
intensity of g-globulin was little in the method with the functionalized HgS
nanoparticles. So these methods have to be applied under rigid experimental conditions.
In this paper, it was found that chromium hydroxide nanoparticles had
low RLS intensity under appropriate conditions. The interaction of the nanoparticles and
proteins by the electrostatic binding can result in a great enhancement of the RLS
intensity. Based on this, we explored here a sensitive RLS method for protein
determination with convenient operation.
2. EXPERIMENTAL
2.1 Apparatus
The RLS intensity and spectra were measured and recorded by a Hitachi F-4500 Fluorescence
Spectrophotometer (Tokyo, Japan) equipped with a 1-cm quartz cell. The concentration of
chromium hydroxide nanoparticles was determined by a WYX-402 Atomic Absorption
Spectrophotometer (Shenyang Analytical Device Plant, Shenyang, China). A pHS-3C digital pH
meter (Shanghai Weiye Instruments Plant, Shanghai, China) was used to measure the pH
values of the solutions. A QL-901 vortex mixer (Jiangsu Clinical Instruments Plant,
Haimen, China) was employed to blend the solution.
2.2 Reagents
Stock solutions of proteins were prepared by dissolving the proteins in water at the
concentration of 100 mg/mL, the working solutions were prepared by diluting stock solutions with water
according to requirements. In this study, proteins involved bovine serum albumin (BSA)
(Sigma Co.), human serum albumin (HAS) (Sigma Co.), insulin (Sigma Co.), gelatin (Tianjin,
H&Y Bio. Co.), chicken egg albumin (CEA) (Sigma Co.) and g-globulin (g-G) (Sigma Co.). Human serum
samples were obtained from Hebei Agricultural University Hospital.
The colloidal
solution of chromium hydroxide (Cr(OH)3) nanoparticles was prepared according
to the literature [13] with slight modification. Briefly, 180 mL of pH 9.5 NaOH
solution was added into a 250 mL three-necked round-bottomed flask and heated to boiling,
and then 10 mL of 6.0×10⁻³ mol/L CrCl3 was dropped slowly into the
flask. Afterwards the mixed solution was refluxed at 102oC
for 5 hours. Finally the colloidal solution was
naturally cooled to room temperature and filtrated with 0.45 mm ultrafiltration membrane.
The colloidal solution was stored at 0 - 4oC. The concentration of filtrated
colloidal solution was determined with atomic absorption spectrophotometry (AAS). The
obtained chromium hydroxide colloidal solution was diluted to 7.5×10⁻⁵ mol/L
(calculated with Cr). The chromium hydroxide colloidal solution was dropped onto 50-Å-thick
copper grids with the excess solution immediately volatilized away. The TEM images of the
nanoparticles were acquired on a JEM -1200EX II electron microscope (Japan). It can be seen from Fig.1, the average
size of chromium hydroxide nanoparticles was about 50 nm. Although the nanoparticles on
the copper grids without solvent were aggregated, the chromium hydroxide colloidal
solution was stable dispersed solution, which can be stable at least two weeks at 0 - 4oC.
All
reagents were of analytical grade, and doubly distilled water was used throughout.
2.3 Procedures
In a 10 mL volumetric flask, 0.6 mL of chromium hydroxide colloidal solution (containing
7.5×10⁻⁵ mol/L Cr), 0.5 mL of HAc-NaAc buffer solution (pH 5.9, 0.1 mol/L) and
a certain volume of protein working solution were added, the mixture was diluted to 10.0
mL with water and stirred thoroughly. After incubation at room temperature for 30 min, the
RLS spectra were obtained by synchronously scanning with the same excitation and emission
wavelength by F-4500 Spectrophotometer in the wavelength range of 200 - 700 nm. The RLS
intensity was measured at the wavelength 341 nm and the slit width and PMT voltage of the
measurements were 5 nm and 400V, respectively.
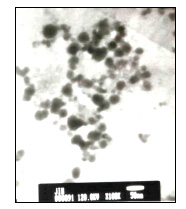
Fig. 1 The TEM image of Cr(OH)3colloidal solution after ultrafiltration
3.1 Spectral characteristics of RLS
Figure 2 shows the light scattering spectra of Cr3+ solution and Cr(OH)3 colloidal solution in the absence and in the presence of BSA. CrCl3 solution is a real solution, the light scattering is only Rayleigh scattering, and so the light scattering intensity is very weak. It can be seen from Fig.2 that the CrCl3-BSA solution almost has the same light scattering intensity as the CrCl3 solution, which means the interaction between Cr3+ and protein cannot cause the increase of light scattering intensity. Due to the Tyndall effect, the light scattering intensity of Cr(OH)3 colloidal solution is stronger than that of Cr3+ solution. When BSA is mixed with Cr(OH)3 colloid solution, the light scattering intensity of Cr(OH)3 colloidal solution is strongly enhanced by BSA and reaches maximum at 341.0 nm.
Fig. 2 Resonance light scattering spectra for Cr3+ (4.5×10⁻⁶ mol/L) solution and Cr(OH)3 colloidal solution (4.5×10⁻⁶ mol/L) in the absence of BSA and in the presence of BSA (1.0 mg/mL) in the pH 5.9 HAc-NaAc buffer (5.0 mmol/L); 1.Cr3+, 2.Cr3+-BSA, 3. Cr(OH)3, 4. Cr(OH)3-BSA
According to the RLS theory [14], RLS effect is
observed as increased scattering intensity at /or very near the wavelength of absorption
of an aggregated molecular species. The effect can be dramatically enhanced when strong
electronic coupling exists among the chromophores. Cr(OH)3 nanoparticles are
the aggregates of Cr(OH)3 molecules at nanoscale dimensions. As shown in Fig.3,
Cr(OH)3 colloidal solution has a maximum absorption peak at 340.0 nm and a wide
absorption band. Compared with Fig.2, the light scattering of Cr(OH)3 colloidal
solution reaches maximum at 326.0 nm, which can be considered as RLS of Cr(OH)3
nanoparticles. When BSA is added into Cr(OH)3 colloidal solution, BSA molecules
may interact with Cr(OH)3 nanoparticles through electrostatic binding, which
leads to the aggregation of nanoparticles and size increase of scattering particles. On
the other hand, when the interparticle distance in these aggregates decreases to less than
approximately the average particle diameter, the aggregation of the nanoparticles can
result in electric dipole-dipole interaction and coupling between the plasmons of
neighboring particles in the formed aggregates [15]. Therefore, it can be
concluded that the size increase of scattering particles and the electronic coupling of
Cr(OH)3 nanoparticles originated from the interaction between BSA and Cr(OH)3
nanoparticles can produce greatly enhanced RLS and form a new RLS peak at longer
wavelength (341.0 nm).
Fig. 3 UV-Vis spectrum of the Cr(OH)3 colloidal solution after
ultrafiltration
Fig. 4 Effect of pH on the RLS of Cr(OH)3 colloidal solution (7.5×10⁻⁶
mol/L) in the absence of BSA (1) and in the presence of BSA (2.0 mg/mL) (2) in the HAc-NaAc
buffer (0.010 mol/L)
3.2 Optimization of the general procedure
The effect of pH values on the RLS intensity of the system was studied by using HAc-NaAc
buffer to adjust the pH value of the solution. As shown in Fig.4, the RLS intensity of
Cr(OH)3 is approximately kept a constant in the pH range from 4.4 to 6.2, but
the RLS intensity produced by BSA gradually increases with increasing the pH value and
reaches its maximum at pH 5.9. Afterwards the RLS intensity decreases at pH 6.2. The
results indicate that the pH value greatly affects the interaction between Cr(OH)3
nanoparticles and BSA. According to the literature [13], the surface of Cr(OH)3
nanoparticles is positively charged, and BSA is also positively charged when the pH value
of solution is lower than the isoelectric point (pI = 4.7) of BSA. Therefore, when pH
value is lower than 4.7, the interaction between Cr(OH)3 nanoparticles and BSA
is rather weak, the RLS intensity is correspondingly low. When pH value is greater than
4.7, BSA is negatively charged, the electrostatic binding of BSA and colloids results in
Cr(OH)3 nanoparticles aggregation through BSA molecules, which causes the RLS
intensity gradually increases. Above pH 5.9, the RLS intensity decreases probably because
the Cr(OH)3 colloids is destroyed at higher pH value.
At pH 5.9, the influence of the concentration of HAc-NaAc buffer on the
enhanced RLS intensity was investigated. Different volume of buffer were respectively
added into Cr(OH)3 and Cr(OH)3-BSA solution. The result shows that
the RLS intensity produced by BSA has a maximum at 5.0 mmol/L HAc-NaAc buffer. With the
increasing of buffer concentration, ionic strength of solution is raised, which results in
decreasing of the RLS intensity. The phenomena suggest the interaction of Cr(OH)3
nanoparticles and BSA is based on electrostatic binding. Therefore, 5.0 mmol/L HAc-NaAc
(pH 5.9) was used to control the pH value of the sample solution.
The effect of the concentration of the Cr(OH)3 colloidal
solution on the RLS intensity of 1.0 mg/mL BSA was studied. When the concentration of Cr(OH)3
colloidal solution is raised from 3.0×10⁻⁶ mol/L to 2.25×10⁻⁵
mol/L, the RLS intensity of Cr(OH)3 is gradually increased, the RLS intensity
of Cr(OH)3-BSA is slightly increased and then presents the decreased trend. The
RLS signal reaches maximum at the concentration of 4.5×10⁻⁶ mol/L. When the
concentration of Cr(OH)3 is relatively high, the BSA molecules will be fully
saturated by Cr(OH)3. The complexes of BSA and Cr(OH)3 nanoparticles
will slowly aggregates and precipitates, which results in the RLS intensity of BSA
gradually decreasing when the concentration of Cr(OH)3 is greater than 4.5×10⁻⁶
mol/L. Therefore, 4.5×10⁻⁶ mol/L was selected as the optimum concentration of
the Cr(OH)3 colloidal solution.
The influence of the incubation time of the Cr(OH)3-BSA
solution on the RLS intensity was also investigated. The RLS signals of both the Cr(OH)3-BSA
solution and Cr(OH)3 colloidal solution were stable after 30 min and showed a
slight change of less than 10% until 120 min. The result proves that the complex can form
immediately when Cr(OH)3 colloidal solution and BSA are mixed, and has a good
stability. According to the results mentioned above, the RLS intensity was measured after
incubation for 30 min.
3.3 Interference of foreign coexisting substance
In order to study the potential interference of various metal ions and amino acids, the
standard solution containing 1.0 mg/mL BSA was premixed with the foreign substance. Then,
the RLS intensity was detected according to the general procedure and compared with that
of the standard solution itself. The tolerance concentration of metal ions and amino acids
are presented in Table 1. From Table 1, it can be seen that the proposed method can
tolerate most of the metal ions at higher concentration (greater than1.0×10-7
mol/L) and the amino acids are tolerated at the concentration from 1.0 to 100.0 mg/mL. The tolerated
concentrations of these coexisting substances are generally greater than that in
biological samples. So these substances do not interfere with the determination of BSA.
Table 1 Effect of coexisting substances
Coexisting substances |
Concentrationa |
Change of RLS Intensity (%) |
Cu2+ |
1.0 |
+3.88 |
Zn2+ |
1.0 |
+4.50 |
Mn2+ |
1.0 |
+1.29 |
Cd2+ |
10.0 |
+1.67 |
Fe3+ |
1.0 |
+3.18 |
Co2+ |
1.0 |
+2.76 |
L-Leucine |
1.0 |
+1.95 |
DL-Threonine |
1.0 |
+3.67 |
L-Glutamic acid |
1.0 |
+3.27 |
L-Alanine |
1.0 |
+1.63 |
L-Arginine |
100.0 |
+4.46 |
L-Histidine |
10.0 |
+2.45 |
Cr(OH)3 nanoparticles: 4.5×10⁻⁶ mol/L; BSA: 1.0 mg/mL; pH 5.9
3.4 Calibration curves
According to above general procedure, the calibration curves for BSA determination were
constructed under the optimum conditions. There is a linear relationships between the
enhanced RLS intensity (DIRLS) and BSA concentration (C)
in the range of 0.08-1.6 mg/mL. The linear regression equation of this assay is DIRLS
= -0.17+39.12 C, the correlation coefficient is 0.9991 and the detection limit (3s) is 18.6 ng/mL.
3.5 Sample determinations
Table 2 RLS signals of different protein
Proteins |
Molecular weight |
RLS signals |
Percentage of BSA (%) |
Insulin |
5733 |
15.59 |
32.1 |
Gelatin |
40000 |
18.08 |
37.2 |
Egg-albumin |
44287 |
32.71 |
51.5 |
BSA |
66000 |
48.54 |
100.0 |
HSA |
66478 |
49.13 |
101.8 |
g -Globulin |
165000 |
53.87 |
116.3 |
1.0 mg/mL of protein was used for each measurement. The results were average value of three measurements.
Table 3 Total contents of proteins in human serum samples (g/L)
Sample number |
Present RLS method (n=5) |
Bradford assay (n=5) |
1 |
47.4 |
44.9 |
2 |
59.1 |
60.0 |
Table 2 displayed the
variation of RLS signal response for different proteins under the above optimal
conditions. Compared with the RLS signal of BSA, the response change of human serum
albumin (HSA) and g-globulin was little. And the RLS signal was decreased about 1-fold
for chicken egg albumin and about 3-fold for insulin and gelatin, which indicates that the
RLS signal response basically depends on the molecular weight of various proteins.
Figure 5 shows the
relationship between RLS intensity and protein molecular weight when the different
proteins are at the same weight (1.0 mg/mL). From Fig.5, it can be seen that the
RLS intensity linearly increases with increasing protein molecular weight in the molecular
weight range of 40000-60000. However, the RLS intensity increases very little with
increasing protein molecular weight when the molecular weight is less than 40000 or
greater than 60000. Therefore, the proposed RLS method is suitable to determine the total
protein in serum samples, in which the
albumin and globulin exhibit lower variation in response signal at the same molecular
weight.
The proposed method was applied to
determine the total protein content of human serum samples. The fresh serum samples were
diluted with doubly distilled water and determined with the RLS method and the Bradford
assay [2]. Table 3 displays the determination results for human serum samples,
which are in good agreement with that of the Bradford assay. Therefore, the proposed
method is practical and adaptable for the determination of total protein in serum samples.
Fig.5 Relationship between RLS intensity and protein molecular weight
4. CONCLUSION
A fast and sensitive RLS method for determination of proteins has been developed by
using Cr(OH)3 nanoparticles as probes. The aggregation of nanoparticles
resulted from the interaction between protein and nanoparticles leads to great enhancement
of RLS signal. It is demonstrated that RLS technique is a powerful tool to detect the
aggregation of nanoparticles. Recently, nanoparticles have been widely used to label
antibodies [15] and DNA probes [16]. The immunoreaction and the DNA
hybridization can result in the aggregation of functional nanoparticles. Therefore, the
proposed RLS method may open up new possibilities for biological assays and clinical
diagnosis.
Acknowledgement The project was supported by the National Science Foundation of China (NSFC, No. 20375011) and the National Science Foundation of Hebei Province (No. 203111).
REFERENCES
[1] Lowry O H, Rosebrough N J, Farr A L et al. J. Biol. Chem., 1951, 193: 265.
[2] Bradford M M. Anal. Biochem., 1976, 72: 248.
[3] Moeremans M, Daneels G, Mey J D. Anal. Biochem., 1985, 145: 315.
[4] Li N, Li K A, Tong S Y. Anal. Biochem., 1996, 233: 151.
[5] Hara T, Toriyama M, Tsukagoshi K. Bull. Chem. Soc. Jpn., 1984, 57: 1551.
[6] Pasternack R F, Bustamante C, Collings P J et al. J. Am. Chem. Soc., 1993, 115: 5393.
[7] Huang C Z, Li K A, Tong S Y. Anal. Chem., 1996, 68: 2259.
[8] Huang C Z, Li Y F, Feng P et al. Fresenius. J. Anal. Chem., 2001,371: 1034.
[9] Jia R P, Zhai H L, Shen Y et al. Talanta, 2004, 64: 355.
[10] Huang C Z, Li Y F. Anal. Chim. Acta., 2003, 500: 105.
[11] Zhu C Q, Li D H, Zhu Q Z et al. Fresenius. J. Anal. Chem., 2000, 366: 863.
[12] Wang L Y, Wang L, Dong L et al. Talanta, 2004, 62: 237.
[13] Onjia A E, Milonjic S K, Cokesa D et al. Materials Research Bulletin, 2003, 38: 1329.
[14] Pasternack R F, Collings P J. Science, 1995, 269: 935.
[15] Thanh N T K, Rosenzweig Z. Anal. Chem., 2002, 74: 1624.
[16] Elghanian R, Storhoff J J, Mucic R C et al. Science, 1997, 277: 1078.
氢氧化铬纳米粒子共振光散射技术测定蛋白质
(保定河北大学化学与环境科学学院,071002)
摘要 用强制水解的方法制备的氢氧化铬纳米粒子可以作为一种新的共振光散射探针对蛋白质进行定量分析。在pH5.9的条件下,氢氧化铬纳米粒子与蛋白质相互作用导致共振光散射信号在250-700nm之间有很大的增强,并且在341nm处散射值达到最大。基于此现象,建立了一种较灵敏的检测蛋白质的方法。测定牛血清蛋白的标准曲线的线性范围是0.08- 1.6mg/mL,检出限是18.6ng/mL。用共振光散射方法对相同量的牛血清蛋白,人血清蛋白和g-球蛋白进行测定,其相应的信号变化不大。此方法被成功的用于人血清样品中总蛋白含量的测定,其结果与考马斯亮蓝方法的测定结果一致,这表明该方法简单,灵敏,可靠。作为一种新的以纳米粒子为探针的共振光散射方法,在对生命物质进行测定研究方面将具有很大的发展潜力。
关键词 氢氧化铬纳米粒子,牛血清蛋白,共振光散射