http://www.chemistrymag.org/cji/2005/07b074pe.htm |
Nov. 10, 2005 Vol.7 No.11 P.74 Copyright |
(College of Life Science and Technology, Jinan University, GuangZhou 510632, China)
Received on Sep. 10, 2005.
Abstract P. globosa is a kind of algae causing large-scale red tide, so it is important to monitor and study p. globosa. The pigments of p. globosa strain were analyzed by using Fluorometric and high performance liquid chromatography (HPLC) methods. The results showed that chlorophyll a and chlorophyll c were detected by ordinary fluorescence and synchronous fluorescence methods. The two fluorometric measurements are rapid and simple. Moreover synchronous fluorescence method separated the chlorophylls entirely and made them not interfere with each other. The pigments contained chl a, chl c, b-carotene and fucoxanthin were analyzed by HPLC analysis. Compared to fluorescence methods, HPLC could measure pigments accurately and separate them more effectively. The determination of chl a concentrations by fluorometry and HPLC may monitor the P. globosa biomass.Keywords P. globosa; ordinary fluorescence method; synchronous fluorescence spectra; HPLC
1 INTRDUCTION
Phaeocystis globosa belongs to the class of the Haptophytes or Prymnesiophytes, which
has a worldwide distribution
P. globosa has a world-wide distribution. In recent years, blooms of p. globosa have caused large-scale red tides frequently, which produce potent toxin. P. globosa blooms appeared each year along the Dutch coast, including the shellfish cultivation areas of the Wadden Sea and the Oosterschelde estuary since the early 1970s [7,8] and in the central Arabian sea in 1996[9]. A dense bloom of p. globosa first occurred in the coastal waters of southeast China in the autumn of 1997 and reoccurred in the summer of 1999[4] and 2005. These episodes posed a serious threat to commercial fisheries and aquaculture, human health and also coastal tourism through the odorous foams on the beaches during the wane. Furthermore, P. globosa produces dimethylsulfoniopropionate (DMSP) and converts it enzymatically into dimethylsulfide (DMS) and acrylate (Veronique et al., 2005; Noordkamp et al, 2000). The oxidation products of DMS have an impact on the chemical quality of the atmosphere and give rise to cloud condensation nuclei that affect cloud albedo. The consequent higher ocean emissions of DMS would counteract global warming [3,10]. So it is important to monitor and study p. globosa. P. globosa biomass is usually determined by spectrophotometer that measures optical density(OD) on algae suspensions. Chlorophyll of the algae has absorbance at 680 nm, but cell density could not be reflected accurately by OD when algae biomass is great. Determination of chlorophyll in phytoplankton has been based on extraction into a solvent followed by fluorometry, more recently, by high performance liquid chromatography (HPLC). Fluorometric measurement has higher sensitivity and accuracy than spectrophotometric analysis, moreover, the synchronous fluorescence spectra has higher selectivity. HPLC allows the separation of pigments that may interfere with chlorophyll a.
In this paper, pigments of p. globosa were analyzed respectively by using fluorometric and HPLC methods. The objective of the study was to find some composition of the pigments and appropriate analysis methods in order to monitor p. globosa biomass.
2 MATERIAL AND METHIDS
2.1 Algal culture conditions
P. globosa was obtained from institute of hydrobiology, Jinan university. The culture
medium used was filtered seawater with f/2 medium. All media components and filtered
seawater were sterilized by autoclaving except for the vitamins, which were
filter-sterilized (0.2
2.2 Fluorometric and HPLC pigment analysis
Algal cells were centrifuged for 15 min at 4000 rpm, and the sediment was sonicated in centrifuge tube, with 5 mL of 90% acetone for 10 min, and another centrifugation step to remove the salts. The supernatant was filtered through a Millex SR 0.2 um filter and analyzed respectively by fluorometric and HPLC methods for pigments within 48 h following extraction to minimize pigment losses through precipitation and adsorption.
2.2.1 Fluorometric measurement
Fluorescence was measured on a 970CRT spectrofluorometer. A xenon lamp source was used for excitation. Excitation and emission slit widths were 10 nm.
Two fluorescence spectra were obtained by measuring the emission spectra, in the range of 460-800 nm, repeatedly, at excitation wavelengths from 250 to 645 nm.
The synchronous fluorescence spectra were connected by simultaneously scanning the excitation and emission monochromator in 550-800 nm range, with constant wavelength differences, Dl of 193, 258 nm.
2.2.2 HPLC pigments analysis
HPLC analysis was conducted based on the ternary gradient method of Kwan et al [11]. An Zorkax SB-aq reversed phase column(4.6 mm ID×25 cm, 5.0 mm particle size) with a flow rate of 1.0 mL min-1 was used. The mobile phase setup consisted of three solvent (solvent A=80:20 methanol: 0.5 M ammonium acetate at pH 7.2; solvent B=90:10 v/v acetonitrile: Milli-Q water; solvent C= pure ethyl acetate). Ammonium acetate was chemical grade and other solvents were HPLC grade. Sample was injected into the HPLC system with slight modifications (0 min, 100% solvent A; 4 min, 100% solvent B; 18 min, 20% solvent B and 80% solvent C; 21 min, 100% solvent B; 23.5 min, 100% solvent A; 29 min, 100% solvent A). Pigments were detected by absorption at 436 nm and identified by comparison of their retention time and spectra with standards, and 90% acetone was used as the blank.
3 RESULTS AND DISCUSSION
3.1 Fluorometric pigment analysis
Fig.1 shows that the fluorescence emission spectrum excited at 446 nm, exhibited two
peaks at 670 nm and 650 nm. Chlorophyll a (chl a) fluorescence peak is at 670 nm, and the
peak of 640 nm is related to chlorophyll c (chl c). F650 is higher than F670.The
relative height of F640 and F670 chlorophyll fluorescence emission
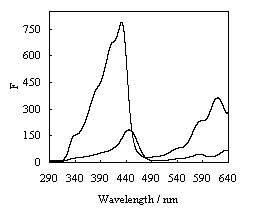
band depend upon chlorophyll of pigments. In excitation spectra measured respectively at
670 nm and 640 nm and showed in Fig. 2, the shape and intensity were different. Three
peaks at 431nm,590nm and 621nm were found in the
fluorescence excitation spectra with emission at 670 nm, and the excitation spectra
measured at 640 nm had two peaks of 446 nm, 590 nm.
The fluorescence spectra with excitation of 431 nm had a peak at 670 nm and the peak of
640 nm disappeared. The pigment composition of the cultured strain of P. globosa
examined in fluorescent measurement is characterized by the presence of chl a and chl c.
Fig.2 presents the intensity of excitation spectra at 670 nm were higher than that of
excitation spectra at 640 nm. From Fig. 1, it was found that Chl a and chl c could be
detected by using ordinary fluorescence method, but their peaks were not separated
completely.
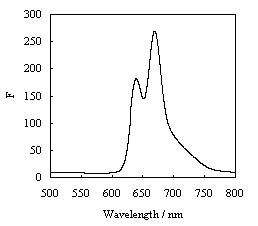
Fig.1 Fluorescence emission spectra of
pigments of P. globosa with excitation at 446nm
Synchronous scanning fluorescence spectroscopy is another technique of great potential in analysis of mixture of fluorescent compounds. As a result, the selectivity for individual components is considerably improved; much more information on mixtures of fluorescent compounds is gained
[12]).Fig. 3 shows the synchronous fluorescence spectra depends on the difference between the excitation and emission wavelengths, Dl. For Dl=193 nm, a maximum at 640 nm in the synchronous spectrum ascribed chl c, the spectra with the peak of 670 nm at Dl=258 nm is the spectrum of chl a. As it is evident from Fig. 3, the main fluorescent components identified are the same with those identified by ordinary fluorescence method. Compared to the emission band, the bandwidths reduced, and the intensity improved. Moreover chl a and chl c were separated completely and did not interfere with each other.
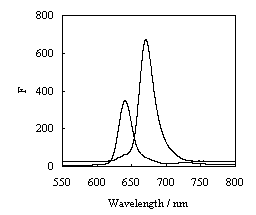
Fig.3 Synchronous fluorescence spectra of pigments of P. globosa
A: Dl=193 nm B: Dl=258 nm
3.2 HPLC pigment signature
Absorption chromatogram of P. globosa strain is showed in Fig. 4. The pigments
contained chl a, chl c, b-carotene
and fucoxanthin and they were separated completely. Chl a and fucoxanthin were the
dominant pigments. Compared to fluorescence method, HPLC could measure pigments accurately
and separate more effectively, although the analysis operation time was longer.
Information on the density of P. globosa populations is central to the study and
surveillance of red tide. Pigments are used as reliable indicator of biomass by pigment
analysis. Pigment concentration is correlated with the density of P. globosa.
Accurate quantification of chl a is often used in phytoplankton biomass in both marine and
freshwater environments
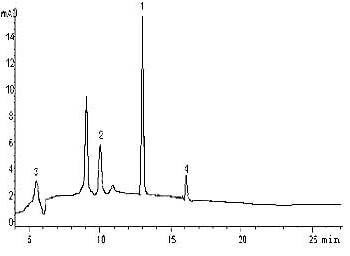
1= chl a, 2= fucoxanthin, 3= chl c, 4= b-carotene fucoxanthin.
4 CONCLUSION
This study confirms that there is a range of pigment compositions in P. globosa.
Chl a and chl c can be identified rapidly by ordinary fluorescence and synchronous
fluorescence methods. Fluorescence emission spectroscopy was successfully used to detect
chlorophylls, but it was difficult to separate chl a and chl c completely. Synchronous
fluorescence method gives a possibility of separating chl a and chl c, and has high
sensitivity, simplicity and selectivity which may serve as a method to determining
chlorophylls concentration.
The pigment composition of the cultured strain of P. globosa
examined in HPLC measurement is characterized by the presence of chl a, chl c, b-carotene and fucoxanthin. Among which
chl a concentrations are the highest. HPLC provides an accurate and effective method for
separating a variety of the pigments of P. globosa strain. Compared to fluorometric
method, HPLC can measure more pigments and overcome the shortcoming of fluorometric method
which can not detect the pigments without fluorescence. P. globosa biomass can be
monitored by the determination of chl a concentrations with fluorometry and HPLC.
Acknowledgements This study was funded in part by the National Natural Science Council, Republic of China (Grant:20277016),973program (Grants: 2001CB409710),and Natural Science Council of Guangdong Province (Grant:04105835).
REFERENCES
[1] Rienman R, Boekel W V. Journal of Sea Research., 1996, 35 (4): 235-242.
[2] Van Rijssel M, Winfried W C J. Journal of Sea Research, 2002, 48: 17-27.
[3] Veronique S, Becquevort S, Stefels J, Rousseau V et al. Journal of Sea Research,
2005, 53: 43-66.
[4] Peter G V, Linda K M. Journal of Marine Systems, 2003, 43: 153-164.
[5] Chen Y Q, Wang N, Zhang P, Zhou H et al. Molecular evidence identifies bloom-forming
Phaeocystis (Prymnesiophyta) from coastal waters of southeast China as Phaeocystis
globosa. Biochem. System. Ecol, 2002, 30, 15-22.
[6] Van Rijssel M, Hamm C E, Gieskes W W C. Eur. J. Phycol, 1997, 32: 185-192.
[7] Smaal A, Twisk F. Journal fo Experiment Matine Biology and Ecology, 1997, 209: 33-46.
[8] Gerhard C C. Journal of Sea Research, 1996, 36 (3/4): 321-327.
[9] Madhupratap M, Sawant S, Gauns M. Oceanologica Acta, 2000, 23: 83-90.
[10] Noordkamp D J B, Gieskes W W C, Gottschal J C et al. Journal of Sea Research, 2000,
43: 287-296.
[11] Kwan W, Kim W. Chemosphere, 2003, 52: 1633-1640.
[12] Sikorska E, Gorecki T, Khmelinskii I et al. Food Chemistry, 2005, 89: 217-225
[13] David S, Stuart H. Wat. Res., 1998, 32: 2220-2223.
王 梅,尹平河, 赵 玲,欧云付,晏荣军
(暨南大学生命科学技术学院,广州510632)
摘要 球形棕囊藻是一种海洋赤潮藻,对其监测和研究有着重要意义。分别运用普通荧光、同步荧光法以及HPLC三种方法,对球形棕囊藻的色素进行分析。结果表明,普通荧光和同步荧光法可检测到叶绿素a和c,方法简便、快速,并且同步荧光法可使叶绿素a和c荧光峰互不干扰,灵敏度高。经HPLC分析,球形棕囊藻色素由叶绿素a、叶绿素c、b-胡萝卜素和岩藻黄质组成,其中叶绿素a和岩藻黄质主要色素。与两种荧光方法相比较,HPLC能更准确的分析色素组成。
关键词 球形棕囊藻;普通荧光;同步荧光;HPLC