http://www.chemistrymag.org/cji/2006/086043pe.htm |
Jun. 1, 2006 Vol.8 No.6 P.43 Copyright |
(School of Material Science and Engineering, Beijing Institute of Technology, Beijing 100081, China)
Abstract At present, Poly (amido amine)
(PAMAM) dendrimers were used as templates for in-situ synthesis of nano-particles because
of their well-defined shape, inner nano-holes and controllable end-groups on the surface.
In this paper, well-dispersed CdS quantum dots (Q-CdS) were prepared through the
protection of methyl ester-terminated generation 3.5 PAMAM dendrimers (G3.5) using H2S
and Na2S respectively; the differences between the two methods were discussed;
the adjustment of the photoluminescence (PL) color of Q-CdS was realized; and the effects
of excess Zn2+ and Cd2+ ions on the optical properties of Q-CdS was
studied in detail. It was found that the contrasts in size, size distribution and the room
temperature photoluminescence quantum yield (RT-PQY) of Q-CdS prepared using the two
methods were caused by the differences in the nucleation process, position and surface
defects of Q-CdS. The photoluminescence (PL) color of Q-CdS was tunable by controlling the
particle size, which was changed by varying the Cd2+/G3.5 molar ratio. The
RT-PQY of Q-CdS after adding excess Cd2+ and Zn2+ ions were improved
nearly 9 and 10 times respectively; and their PL lifetimes increased about 5 and 8 times
respectively. These results were attributed to the decrease of surface defects and the
formation of the Schottky-like barrier.
Keywords Q-CdS; PAMAM dendrimers; Optical property; Room temperature PL quantum
yield; PL lifetime
1. INTROUDUCTION
Owing to their tunable photoluminescence (PL) color, longer PL lifetime, higher RT-PQY
and optical stability than organic dyes, Ⅱ-Ⅵ
semiconductor quantum dots are promising to find many novel
applications, such as fluorescence probes, photo catalysts, and photoelectric converters [1-2].
Before realizing their widespread applications, the following factors are necessary: high
RT-PQY, tunable size, narrow size-distribution, controllable solubility both in organic
and inorganic solvents et al. But most of nano-particles prepared using the common methods
can not meet these needs simultaneously. Therefore, a lot of researchers have been engaged
in searching for new approaches to solve the problems. The development of dendrimer
provides a new method for preparing nano-materials. The nano holes inside the dendrimer
can act as reaction vessels and prevent the nano-particles from aggregation. Since the
abundant end groups are easy to be modified, the solubility of semiconductor
nano-particles both in organic and inorganic solvent will be controllable. Some
nano-particles such as Ag, Cu, Pt and Pd clusters [3-8] were synthesized by
using PAMAM dendrimers as templates, which were called PAMAM dendrimer nano-composites
(PAMAM DNC). It has been found that PAMAM dendrimers were excellent stabilizers in
preparing compound semiconductor nano-particles. Sooklal [9] prepared CdS
quantum dots (Q-CdS) using carboxyl and amine terminated PAMAM dendrimers as stabilizing
agents, and the average diameter of Q-CdS was about 3nm. But the Q-CdS/PAMAM DNC
aggregated gradually in solution and formed large aggregates with the size over 100nm.
Lemon [10] prepared Q-CdS using hydroxyl-terminated PAMAM dendrimers as
templates and no aggregation of Q-CdS formed. He found that the size of Q-CdS grew with
the increase of generation of PAMAM dendrimers. Also, Wu [11] synthesized Q-CdS
that located on the surface of the amine-terminated PAMAM dendrimers of generation 8.0.
But the PL lifetime of the Q-CdS was less than 2 ns, and it was affected slightly by
excess metal ions. In this paper, Q-CdS was prepared by a novel method: Cd2+
ions coordinated with the inner groups of G3.5 PAMAM dendrimer fully, and then Q-CdS was
prepared by adding S2- ions. We found that the methyl ester-terminated PAMAM
dendrimer of generation 3.5 was another excellent inner template, the size-distribution of
Q-CdS was very narrow, and the size grew with the Cd2+/PAMAM molar ratio.
Differing from the results of Wu, excess Cd2+ and Zn2+ metal ions
increased the PL intensity and PL lifetime greatly.
In this paper, Q-CdS was prepared by adding two sulfide sources: Na2S
and H2S. The differences between the two methods were discussed carefully.
Furthermore, the effects of Cd2+/PAMAM molar ratio on the size and PL color of
Q-CdS, effects of excess Cd2+ and Zn2+ ions on the optical
properties were discussed in detail. The morphology of Q-CdS was measured by HRTEM, and
their optical properties were characterized by UV-vis spectra, PL spectra, and PL decay
curves.
2. EXPERIMENTAL SECTION
2.1 Materials and Instruments
All chemicals used were of analytical grade. Cadmium acetate (Cd(CH3COO)2?/FONT>2H2O),
zinc acetate (Zn(CH3COO)2?/FONT>2H2O), ferrous sulfide
(FeS), sulfuric acid (H2SO4), sodium sulfide (NaS?9H2O),
sodium hydroxide (NaOH), acetic acid, methanol, ethylenediamine, methyl acrylate, quinine
sulphate et al were purchased from Beijing Chemical Reagent Inc. Methanol, ethylenediamine
and methyl acrylate were purified by distillation. H2S gas was prepared by
dripping H2SO4 of 1mol/L into the flask loaded with surplus FeS.
PAMAM dendrimers of generation 3.5 were synthesized according to ref [12].
High resolution transmission electron microscopy (HRTEM) image was
performed on a JEM-2010 TEM at 200Kv, and the TEM image was performed on a Hitachi H-700
TEM. UV-Vis absorption spectra were measured at room temperature with an UV-2102-PC
Spectrophotometer (Shanghai UNICO Instrument Inc, China). The PL spectra were recorded at
room temperature with a Cary Eclipse fluorescence spectrophotometer (Varian, USA). The PL
lifetime was measured with a FL900 spectrometer (Edinburgh Instruments Ltd. U.K.).
2.2 Synthesis of Q-CdS under the protection of G3.5
Firstly, cadmium acetate methanol solution of 1.0×10⁻² mol/L was dripped into
PAMAM dendrimer of G3.5 methanol solution of 5.0×10⁻⁴ mol/L, then methanol was
added till the concentration of G3.5 reached 1.0×10⁻⁴ mol/L. The reaction
solution was agitated rapidly at room temperature for 48h, after that, Cd2+
ions coordinated with the G3.5 completely [13]. Then a little excess H2S
or equivalent freshly prepared sodium sulfide solution (the molar ratio of methanol to
water was 9:1) were added one-shot, and transparent Q-CdS/PAMAM DNC was synthesized. In
this experiment, Q-CdS of different size was prepared at different Cd2+/G3.5molar
ratio. These reactions were all carried out at the room temperature. The RT-PQY was
measured by comparison to a quinine sulphate reference of the same absorbance (±1%) [14].
3. RESULTS AND DISCUSSTION
3.1 Effects of S2- ion sources
Well-dispersed Q-CdS were prepared using Na2S and H2S respectively
at the same PAMAM concentration (1×10⁻⁴mol/L) and Cd2+/PAMAM molar
ratio (2.5:1). One could see from the HRTEM images of Q-CdS shown in Figure 1 that the
average diameter of Q-CdS was 1.5nm (made by using Na2S) and 3.8nm (made by
using H2S). As shown in Figure 1-c, the size distribution of the Q-CdS made
using Na2S was narrower than that of Q-CdS made using H2S.
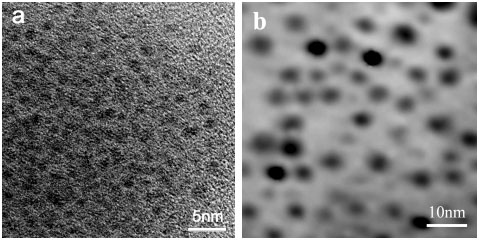
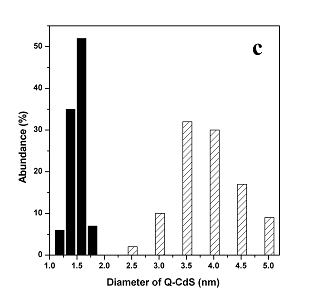
Figure 1 HRTEM image of Q-CdS made using Na2S
(a) and TEM image of Q-CdS made using H2S (b); Histograms of Q-CdS size
distribution when using Na2S (black histogram) and H2S (sparse bias
histogram) as S2- ion source (c).
The absorption and PL
spectra of the Q-CdS prepared using H2S were at the low-energy direction and
the spectra were broader than that of Q-CdS prepared using Na2S (as shown in
Figure 2), which indicated that the size of Q-CdS prepared using H2S was larger
and the size distribution was broader. The conclusions obtained from TEM and UV-Vis
absorption spectra were consistent, so we characterized the size of Q-CdS using the
absorption spectra during the following experiments.
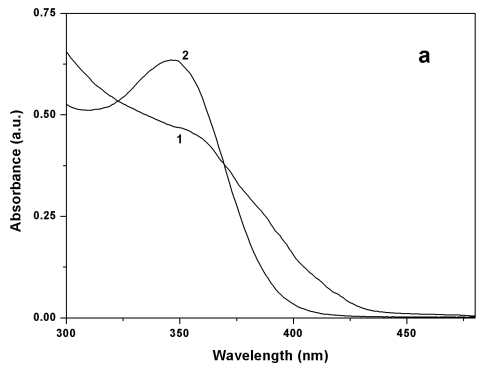
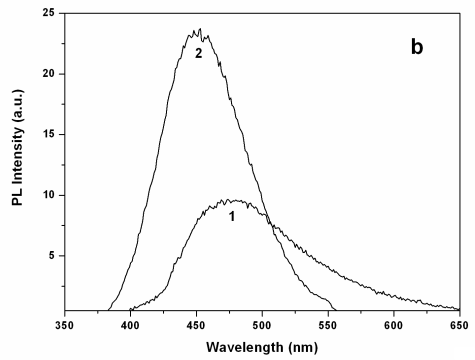
Figure 2 Absorption spectra (a) and PL spectra (excitated at 348nm) (b) of Q-CdS prepared using two sulfide sources: (1) H2S, (2) Na2S.
Since the ligand field
intensity of tertiary amine and amido groups inside the G3.5 PAMAM dendrimer was stronger
than that of peripheral methyl esters, nearly all Cd2+ ions coordinated with
the inner groups first [10] when the Cd2+/G3.5 molar ratio is less
than 16 (the maximum coordination number of a G3.5 dendrimer molecule with Cd2+
ions in methanol [12]). Therefore, Cd2+ ions in-situ reacted with S2-
ions, and the Q-CdS was enclosed in the nano holes of G3.5 dendrimers. Since the
aggregation of Q-CdS was prevented by the branched chains of G3.5, the Q-CdS colloid was
still clear after a year. The size of Q-CdS prepared using both S2- ion sources
was less than the hydrodynamic diameter (about 4.5nm) of G3.5 PAMAM dendrimers.
The differences between the size and size-distribution of Q-CdS
prepared using the two methods were attributed to this reason: the nucleation process of
Q-CdS in the two methods were different. When a H2S molecule dissolved in the
methanol solution, the S2- ion combined with a Cd2+ ion to form a
CdS molecule. While the other two H+ ions exchanged with the Cd2+ ions
that coordinated with those tertiary amine groups inside the PAMAM dendrimer, leading to
continued loss of Cd2+ into solution. The extricated Cd2+ combined
with other S2- ions both inside and outside the G3.5 dendrimer, causing the
nucleation process occurred both inside and outside the dendrimer. The growth of CdS
nuclei was not limited by the nano holes of dendrimers, but by the peripheral methyl
esters of many G3.5, resulting in larger CdS particles and broader particle size
distribution. However, when Na2S was used as the sulfide source, the Na+
ion was less effective at displacing the Cd2+ coordinated with G3.5 dendrimers.
The nucleation process then occurred inside the dendrimer, leading to more uniform
nucleation, more nuclei, and smaller final particle size. Differences on the size and size
distribution of Q-CdS were more obvious when the Cd2+/PAMAM molar ratio was
larger.
The PL spectra shown in Figure 2 were measured at the excitation
wavelength of 348nm, and were band edge emitting. The PL peak position of Q-CdS was 491nm
(H2S as sulfide source) and 453nm (Na2S as sulfide source)
respectively, suggesting that Q-CdS synthesized by using H2S was larger than
that by using Na2S. While the PL intensity of Q-CdS prepared by using H2S
was much lower. These mainly attributed to the larger particle size and broader particle
size distribution of Q-CdS prepared using H2S. In addition, the little excess H2S
formed sulfur-dangling bonds on the Q-CdS surface, resulting in the increase of
nonradiative routes and the decrease of the PL efficiency. Consequently, the Q-CdS used in
the following experiments were all prepared by using Na2S. Moreover, the
one-shot feeding of Na2S induced very high nuclei concentration, which followed
by nuclei growing inside G3.5 dendrimers with high Cd2+ and S2- ions
concentration [15]. This process resulted in narrower size distribution,
narrower UV-vis absorption and PL spectra, and higher PL efficiency. Furthermore, the
large stokes shift between UV-vis absorption spectra and PL spectra will make it easier to
be resolved when using as PL probes. The optical properties of Q-CdS changed little after
storage at room temperature for six months in dark, which suggested the optical properties
of Q-CdS were very stable.
3.2 The tunable PL color of Q-CdS
In order to control the photoluminescence color, we synthesized Q-CdS of different
size by changing the Cd2+/G3.5 molar ratio. The Cd2+/S2-
molar ratio was fixed as 1:1 during the preparation. As shown in Figure 3, the absorption
spectra shifted to the red with the increase of Cd2+/G3.5 molar ratio,
indicating the formation of larger Q-CdS. Correspondingly, the maximum PL wavelength
shifted from 430nm to 474nm, i.e. the PL color changed from purple to blue. Furthermore,
the PL efficiency increased with the raise of Cd2+/G3.5 molar ratio slowly, and
reached the maximum when the molar ratio was 2.5. Then the PL efficiency decreased with
the further increase of Cd2+/G3.5molar ratio,which was caused by the effects of the small size. On the other
hand, the curvature of the Q-CdS increased with the decrease of diameter, which brought
more dangling bonds and more surface defects, leading to lower PL efficiency. Under these
two contrary effects, the PL efficiency of Q-CdS reached its maximum value when the Cd2+/G3.5
molar ratio was 2.5.
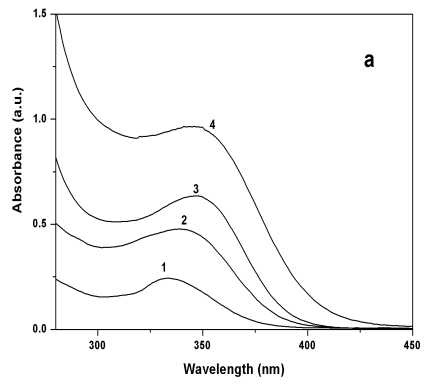
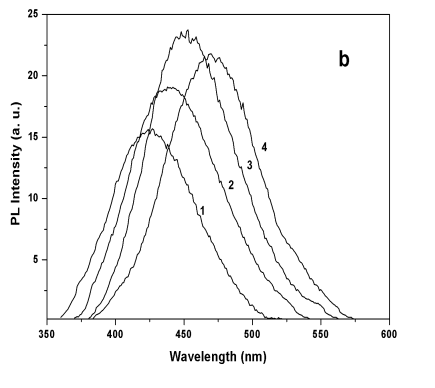
Figure 3 Absorption spectra (a) and PL
spectra (b) of Q-CdS at different Cd2+/G3.5 molar ratio: (1) 0.5, (2) 1, (3)
2.5, (4) 5.
Relationships between the
size, PL color of Q-CdS and Cd2+/G3.5 molar ratio were given in Table 1. The
size of Q-CdS was estimated by Brus model [16] according to the absorption edge
values.
Table 1 Relationships between the size, PL color of Q-CdS and Cd2+/G3.5
molar ratio
Cd2+/G3.5 Molar ratio |
Abs. edge value (nm) |
Size estimated by Brus model (nm) |
PL peak position (nm) |
PL color |
0.5 1 2.5 5 |
370 381 386 398 |
2.3 2.6 2.8 3.2 |
430 441 453 474 |
Purple Purple Blue Blue |
3.3 Effects of excess Cd2+ and Zn2+
ions on the PL efficiency
The PL efficiency of semiconductor nano-particles was affected greatly by the surface
conditions, and the surface conditions of colloidal nano-particles were influenced by the
colloidal solution conditions firstly. Researchers found that excess metal ions influenced
the optical properties of CdS apparently [17]. In this paper, the effect of
excess Cd2+ and Zn2+ ions on the optical properties of Q-CdS was
investigated carefully. Since the solubility constant of CdS was very low (3.6×10⁻²⁹
mol2/L2), we assumed that all Cd2+ ions had turned into
CdS. For convenience, the excess metal ions were counted by the molar ratio of metal ions
to CdS molecule. The changes of UV-vis absorption spectra and PL spectra of different
samples were compared and discussed in detail. The samples added Cd2+ ions and
Zn2+ ions were named sample 1 and sample 2 respectively. As shown in Figure 4,
the UV-vis absorption spectra of sample 1 shifted to the red comparing with that of the
sample without excess metal ions (blank sample), and the absorption edge wavelengths
became shorter with the increase of excess Cd2+. While the UV-vis absorption
spectra of sample 2 all shifted to the blue comparing with that of the blank sample. The
PL spectra of samples before and after the addition of excess metal ions at the excitation
wavelength of 348nm were shown in Figure 5. The PL intensities of both samples with excess
metal ions increased dramatically. Sample 2 reached the largest PL-PQY (0.18) when the Zn2+/CdS
molar ratio was 3, while the PL peak position unchanged. Sample 1 reached the largest
PL-PQY (0.11) when the Cd2+/CdS molar ratio was 4, but the PL spectrum shifted
to the red slightly. Relationships between PL intensities at the peak position and Cd2+/CdS
molar ratios (solid line), Zn2+/CdS molar ratios (dotted line) were fitted with
a Boltzmann function. Before the PL intensity attained its maximum value, the curves were
fitted well. But the PL intensity of both samples decreased slowly with the further
increase of excess metal ions.
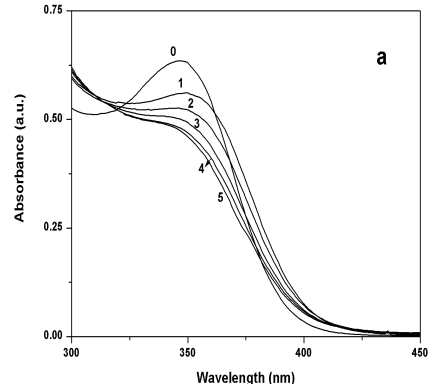
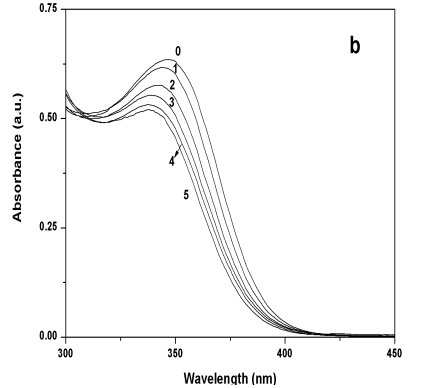
Figure 4 (a) UV-Vis absorption spectra of
sample 1 when Cd2+/CdS molar ratio was 0, 1, 2, 3, 4, and 5; (b) UV-vis
absorption spectra of sample 2 when Zn2+/CdS molar ratio was 0, 1, 2, 3, 4, and
5.
The principle of above
phenomena was analyzed as follows. It was well-known that CdS colloidal particles were
electronegative when S2- ions were equivalent or excess during the preparation
process. The dangling bonds of S2- ions adsorbed on the surface of Q-CdS
increased nonradiative recombination centers. Therefore, the PL intensity was low for
Q-CdS prepared at the equivalent Cd2+/S2- molar ratio. When Cd2+
ions were over-dose, excess Cd2+ ions reacted with the S2- ions
located on the surface of Q-CdS, increasing their size at some extent. This fact was
verified by the small red shifts of the UV-vis absorption spectra and PL peak positions.
Since the solubility constant of ZnS (1.2×10⁻²³ mol2/L2)
is much larger than that of CdS, the excess Zn2+ ions can not replace Cd2+
ions to form a ZnS shell. Consequently, the UV-vis absorption spectra and PL spectra did
not shift to the red. Moreover, the UV-vis adsorption spectra shifted to the blue with the
increase of the excess Zn2+ions. It seemed as if the size of Q-CdS became
smaller according to the Brus model, whereas the PL peak position was fixed, indicating
that the size of Q-CdS was unaltered. This inconsistency will be explained in the next
section.
Moore [16] described this phenomenon using the model of
surface Schottky-like barrier caused by surplus metal ions. In this paper, excess Cd2+
and Zn2+ ions compressed the electric double layers of the CdS colloidal
particles to the area very near the surface, which reduced the surface defects such as the
sulfur dangling bonds. At the same time, a Schottky-like barrier came into being and the
charge carriers were confined within the Q-CdS [17], thus the nonradiative
recombination of carriers was restricted, leading to the higher PL efficiency. Also the
activation energy of electron transition was increased slightly owing to the limitation of
the Schottky-like barrier, which resulted in the absorption spectra of Q-CdS shifting to
the blue slightly with the increase of excess metal ions. Vazquez-Olmos [18]
also observed this phenomenon during studying the activation of CdS nano-particles by Mn2+
and Cu2+ ions.
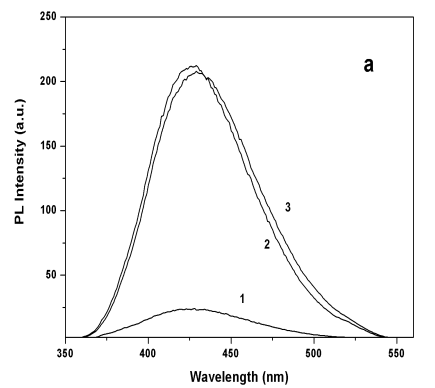
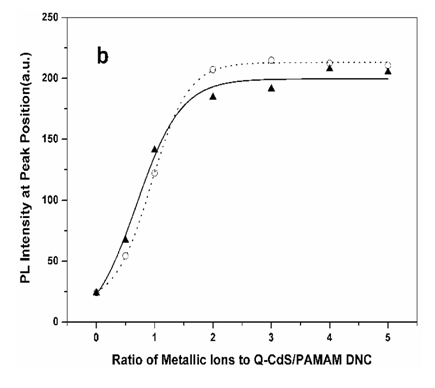
Figure 5 (a) PL spectra of Q-CdS before and
after adding excess metal ions: (1) blank sample, (2) sample 2 (Zn2+/CdS molar
ratio was 3) (3) sample 1 (Cd2+/CdS molar ratio was 4); (b) PL intensities of
Q-CdS before and after adding Cd2+ ions (solid line) and Zn2+ ions
(dotted line) at the PL peak position.
3.4 Effects of excess metal ions on the PL lifetime
The PL lifetime relates intimately to the surface conditions of the semiconductor
nano-particles, and is called a “structure-sensitive”
parameter. Also it is expected that the semiconductor quantum
dots possess longer PL lifetime when used as fluorescence probes. In this paper, excess Zn2+
ions and Cd2+ ions effectively reduced the surface defects, eliminated the
nonradiative pathways, increased the PL RT-PQY, but also prolonged the PL lifetime of
Q-CdS remarkably. PL decay curves shown in Figure 6 were fitted with the following
bi-exponential function,![]() , yielding the
fitting parameters in Table 2. The PL lifetime of Q-CdS in our case was 12 times longer
than that reported by Wu [11], which was about 2 ns. After adding excess Zn2+
and Cd2+ ions, both the fast decay part and the slow part of the PL decay
increased remarkably, and besides, the ratio of the fast decay part increased
dramatically. Such long PL lifetime will expand the usage of Q-CdS/PAMAM nano-composites.
, yielding the
fitting parameters in Table 2. The PL lifetime of Q-CdS in our case was 12 times longer
than that reported by Wu [11], which was about 2 ns. After adding excess Zn2+
and Cd2+ ions, both the fast decay part and the slow part of the PL decay
increased remarkably, and besides, the ratio of the fast decay part increased
dramatically. Such long PL lifetime will expand the usage of Q-CdS/PAMAM nano-composites.
The photoluminescence of Q-CdS comprised mainly two emitting states
with different energies. The fast decay corresponded to an emitting state with a short
lifetime, while the slow decay came from an emitting state with a long lifetime. Since the
lifetime was determined by both radiative decay and nonradiative decay, the prolonged
lifetime of samples meant that the radiative decay dominated. These phenomena were
attributed to the decrease of surface defects and the formation of the Schottky-like
barrier. Furthermore, Zn2+ ions were more effective than Cd2+ ions
on eliminating defects on the Q-CdS surface. Also, samples with higher RT-PQY possessed
longer PL lifetime.
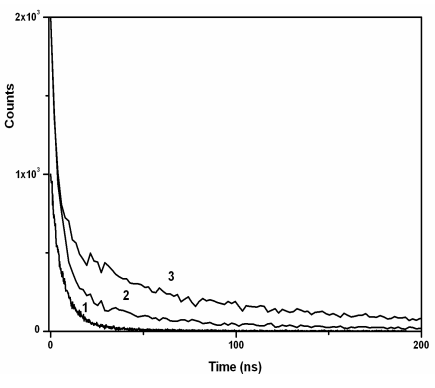
Figure 6 PL decay curves of Q-CdS before and after adding excess metal
ions: (1) blank sample, (2) sample 1 (Cd2+/CdS molar ratio was 4), (3) sample 2
(Zn2+/CdS molar ratio was 3)
Table 2 Fitting parameters of the bi-exponential PL decay curves
Q-CdS |
A1 |
τ1(ns) |
A2 |
τ2(ns) |
X2 |
Blank sample Sample 1 (Cd2+/CdS molar ratio was 4) Sample 2 (Zn2+/CdS molar ratio was 3) |
0.24 0.66 0.69 |
24.59 115.01 186.78 |
0.76 0.34 0.31 |
6.03 13.10 39.62 |
1.092 1.064 1.172 |
4. CONCLUSIONS
We prepared Q-CdS by using Na2S and H2S respectively under the
protection of G3.5 PAMAM dendrimers. The comparison of Q-CdS synthesized by both methods
showed (i) H2S disrupted the coordination bonds of Cd2+ with G3.5,
therefore the dendrimer did not effectively restrict the growth of Q-CdS, (ii) Na2S
was a better S2- ions source, since the Q-CdS prepared using Na2S
was enclosed inside the dendrimer, and the G3.5 PAMAM dendrimer played the role of inner
templates. The PL color of Q-CdS was controlled by changing the Cd2+/G3.5 molar
ratio at a fixed PAMAM dendrimer concentration. The PL intensity reached up to the maximum
when the Cd2+/G3.5 molar ratio was 2.5. The effects of excess Zn2+
and Cd2+ ions on the optical properties of Q-CdS were studied and the results
showed that the RT-PQY and PL lifetime increased greatly due to the decrease of the
surface defects and the formation of the Schottky-like barrier.
Since the abundant end-groups of PAMAM dendrimers are easy to be
modified to control the solubility of Q-CdS in organic or inorganic solvent, the
Q-CdS/PAMAM DNC are promising to be assembled into films or used as long-lifetime
fluorescence probes.
Acknowledgments Thanks for the sustentation of the Fundamental Research Foundation of Beijing Institute of Technology (No. BIT-UBF-200504E4203).
REFERENCES
[1] Bruchez M. Jr., Moronne M., Gin P., et al. Science, 1998, 281: 2013.
[2] Chan W. C. W., Nie Shuming. Science, 1998, 281: 2016.
[3] Li Guoping, Luo Yunjun, Tan Huimin. Acta Chimica Sinica (Huaxue Xuebao), 2004, 62:
1158.
[4] Li Guoping, Luo Yunjun, Tan Huimin. J. Solid State Chemistry, 2005, 178: 1038.
[5] Zhao M., Sun L., Crooks R. M. J. Am. Chem. Soc., 1998, 120: 4877.
[6] Zhao M., Crooks R. M. Adv. Mater. 1999, 11: 217.
[7] Zhao M., Crooks R. M. Angew. Chem. Int. Ed. 1999, 38: 364.
[8] Crooks R. M., Zhao M., Sun L., et al. Acc. Chem. Res. 2001, 34: 181.
[9] Sooklal K., Hanus L. H., Ploehn H. J., et al. Adv. Mater. 1998, 10: 1083.
[10] Lemon B. I., Crooks R. M. J. Am. Chem. Soc. 2000, 122: 12886.
[11] Wu X. C., Bittner A. M., Kern K. J. Phys. Chem. B, 2005, 109: 230.
[12] Cui Yanxia. M. S. Dissertation, Beijing Institute of Technology, Beijing, 2003 (in
Chinese).
[13] Cong Rimin, Luo Yunjun, Li Guoping, et al. Acta Chimica Sinica (Huaxue Xuebao), 2005,
63: 421.
[14] Chen Guozhen, Huang Zhixian, Xu Jingou, et al. Fluorometric Analysis [M], Beijing,
China: Science Press 1990, 1.
[15] Talapin D. V., Rogach A. L., Shevchenko E. V., et al. J. Am. Chem. Soc. 2001, 124:
5782.
[16] Brus L. E. J. Phys. Chem. 1986, 90: 2255.
[17] Moore D. E. and Patel K., Langmuir, 2001, 17: 2541.
[18] Olmos A. V., Diaz D., Gattorno G R., et
al. Colloid Polym. Sci. 2004, 282: 957.
丛日敏,罗运军,李国平,王晓青
(北京理工大学材料科学与工程学院 中国北京100081)
摘要 聚酰胺-胺(PAMAM)树形分子为单分散的球形结构,具有纳米级空腔和易于改性的密集的表面官能团,被广泛地用作制备纳米粒子的模板,并能促进这种纳米材料在自组装及检测材料方面的应用。本文以3.5代PAMAM树形分子(64个甲酯端基)为模板,分别以H2S和Na2S为硫源原位合成了分散良好的CdS量子点。分别研究了两种硫源对制备CdS量子点的影响、CdS量子点发光颜色的可调节性、以及过量的Zn2+ 和Cd2+ 离子对其光学性能的影响。实验发现用Na2S制备的CdS量子点的尺寸更小,尺寸分布更窄,室温光致发光效率更高,这是由于CdS量子点的生长过程和位置不同,表面缺陷状态不同造成的。通过改变Cd2+离子与树形分子的比值可以改变CdS量子点的尺寸,从而调节其光致发光颜色。过量的Zn2+ 和Cd2+ 离子对CdS量子点的吸收和发光性能都有较大影响,分别能使其室温光致发光效率提高9倍和10倍;并使其发光寿命分别延长5倍和8倍。这是由于过量的Zn2+ 和Cd2+ 离子能够形成类Schottky 能垒,并能有效消除CdS量子点的表面缺陷。
关键词 CdS量子点,PAMAM树形分子,光学性能,室温光致发光效率,光致发光寿命