http://www.chemistrymag.org/cji/2008/107034pe.htm |
Jul.
1, 2008 Vol.10 No.7 P.34 Copyright |
Zhou Jianke, Zhao Ruifeng, Wang Lishuang,
Yang Lifeng
(Research Center of Physics and Chemistry Analysis, Hebei University; Hebei Province Key
Laboratory of Analytical Science and Technology, Baoding, 071002, China)
Keywords Matrix solid phase dispersion; Liquid chromatography; Pickled quail eggs; phenolic environmental Estrogens
1. INTRODUCTION
Bisphenol A,Diethylstibestrol and nonylphenol
belong to the phenolic environmental estrogens, have estrogen activity and antagonizing
androgen effect. These compounds can enter human body through food chain, cumulate for a
long time in clay, eject difficultly even do not eject. Teratogenic, carcinogenic and
toxic properties of these compounds have been reported in the literature. Therefore, the
monitoring and detecting their residues in food can be a significant route to human
healthy. HPLC is an analytical method with the advantage of direct detection and simple
operation for phenolic environmental estrogens [1], Liu Haiwen et al. detected
BPA, NP and other five environmental estrogens by RP-HPLC in plastic toys [2]
and Liu Hong et al. used RP-HPLC for determining DES in milk [3]. But, the
determination of trace contaminants in complex matrices, such as food, often requires
multifarious sample extraction and preparation process prior to instrumental analysis.
Matrix solid-phase dispersion (MSPD) is an effective sample preparation technique, first
reported in 1989, by American professor Baker [4]. MSPD has found particular
application as an analytical process for the preparation, extraction and fractionation of
solid, semi-solid and/or highly viscous biological samples [5]. For example,
Pensado et al. described the performance of MSPD for the extraction of polycyclic aromatic
hydrocarbons (PAHs) in fish tissue [6]; Kunihiro Kishida et al. used MSPD to
extract residual sulfonamides in chicken [7]; and Zheng Ping et al. applied
MSPD to extract aflatoxins in hot chilli products [8]. Compare with classical
extraction methods, MSPD combines sample homogenization, cell broken, extraction and
clean-up in a single step, which can avoid the general drawbacks, such as the use of a
large amount of solvent and glassware the laborious extraction procedure and the
occurrence of troublesome emulsions. In the experiment, we applied MSPD to treat pickled
quail eggs, detected the three phenolic environmental estrogens simultaneity by HPLC, the
result was satisfactory.
2. EXPERIMENTAL SECTION
2.1 Apparatus and reagents
The chromatographic system consisted of LC-10AT liquid delivery pump, 7725i model manual
injector and SPD-10A UV/VIS detector from Shimadzu (Japan). The N-2000 Double-Channel
Chromatograph Date Operation System was purchased from Intelligent Information Technology
Graduate School of Zhejiang University. The UV-265 Ultraviolet-visible Spectrophotometer
was from Shimadzu (Japan). The SZ-93 automatic double water distilling apparatus was from
Shanghai Yarong Biochemistry Instrument Company.
Bisphenol A (BPA), Diethylstibestrol (DES) and nonylphenol (NP) were
purchased from Sigma (St. Louis, MO, USA). Acetonitrile, methanol, n-hexane and
dichloromethane, all HPLC grade, were supplied by kermel (Tianjin, China). Ethanol,
petroleum ether (fraction 60-90) and other reagents were analytical reagent. The Florisil
(150-250
2.2 Chromatographic conditions
The analytical column was a reversed-phase Diamonsil C18 column (5mm,250mm×4.6mm i.d.). The proposed mobile phase was methanol- water (85:15, v/v). The flow rate was 1.0ml/min. The temperature of the column was kept at room temperature. The optimal detected wavelength was 227nm. The injection volume was 5.0mL.
2.3 Preparation of standard solutions
The standard stock solution (1.0mg/mL) was prepared by dissolving 10.0mg BPA, 10.0mg DES and 10.0mg NP in a 10mL volumetric flask and make up to volume with methanol. A series of standard solutions were prepared by diluting the standard stock solution with methanol.
2.4 Sample pretreatment
An aliquot of the yolk sample (0.5 g) was gently blended with 1.0 g of Florisil (1.5 g Florisil when treat albumen sample) into a glass mortar (50mL capacity) using a glass pestle, until a homogeneous mixture was obtained. This homogenized sample was transferred and packed into a glass syringe (10mL) with a piece of filter paper on the bottom, put another filter paper on the top of mixture and compressed using the syringe plunger. Interfering compounds such as lipin were washed with 2ml petroleum ether (This process was for the yolk sample merely). The target component was eluted with 6mL of dichloromethane by gravity (using 8mL of dichloromethane eluted for treat albumen sample), allowing the eluate to drip slowly into a 10mL volumetric flask, diluting with dichloromethane to volume. Transferred 2mL solution from volumetric flask through 0.45mm microvoid filter film into a graduated tube, concentrated under a nitrogen stream to dry, added 0.2mL mobile phase into the tube, injected 5mL into the HPLC system.
3. RESULTS AND DISCUSSION
3.1 Multi-factorial optimizations of MSPD extraction conditions
3.1.1 The selection of dispersant
In our work, we researched the efficacy of XAD-2 resin, Chromosorb, neutral activated alumina,
acidic activated alumina and Florisil that acts as the dispersant. It has been
demonstrated that XAD-2 resin, Chromosorb, neutral activated alumina and acidic activated
alumina as the dispersant blended with sample, after treatment and chromatographic
analysis, the recovery is lower than 40% because impurity interfere. Comparatively,
Florisil as the dispersant, the target compounds had better elution efficacy, there is no
impurity interference basically, and the recovery is more than 80%.We has been
investigated the impact of different ratio of sample and Florisil. Figure 1 show that 1:2
is the best ratio for yolk sample treatment and explains that 1:3 is the best ratio for
albumen sample treatment.
3.1.2 The choice of purge and elution solvents
Lipids may be the main interference in the analysis of Trace compounds in biological sample. In Chromatographic Analysis, the Lipids can affect the active surface of the stationary phase and degrade the resolving power of the column, so we must be avoided or reduced the presence of lipids in the extracts. Both n-hexane and petroleum ether can remove lipids, the experimental result show that petroleum ether is better than n-hexane. We had has been investigated the impact of different eluent, such as methanol, Ethanol, Acetonitrile and dichloromethane. By compared the recovery, applied dichloromethane as eluent, the recovery is maximal. Thus, we selected petroleum ether to wash off lipids and other interference, dichloromethane as the best eluent. To evaluate the elution volume of dichloromethane, we used 4mL, 6mL, 8mL, and 10ml dichloromethane to perform elution, Figure 2 show the result that 6mL dichloromethane can fulfill better elution for yolk sample preparation and 8mL dichloromethane can fulfill better elution for albumen sample preparation. Because of many unknown interfering compounds in the yolk sample, they could be eluted when increasing the volume of dichloromethane. When the nonylphenol was detected, there would appear a peak of impurity near the peak of nonylphenol, if the volume of dichloromethane goes beyond 6mL. The interferer led that the integral of peak area was influenced, so the recovery of nonylphenol reduced obviously.
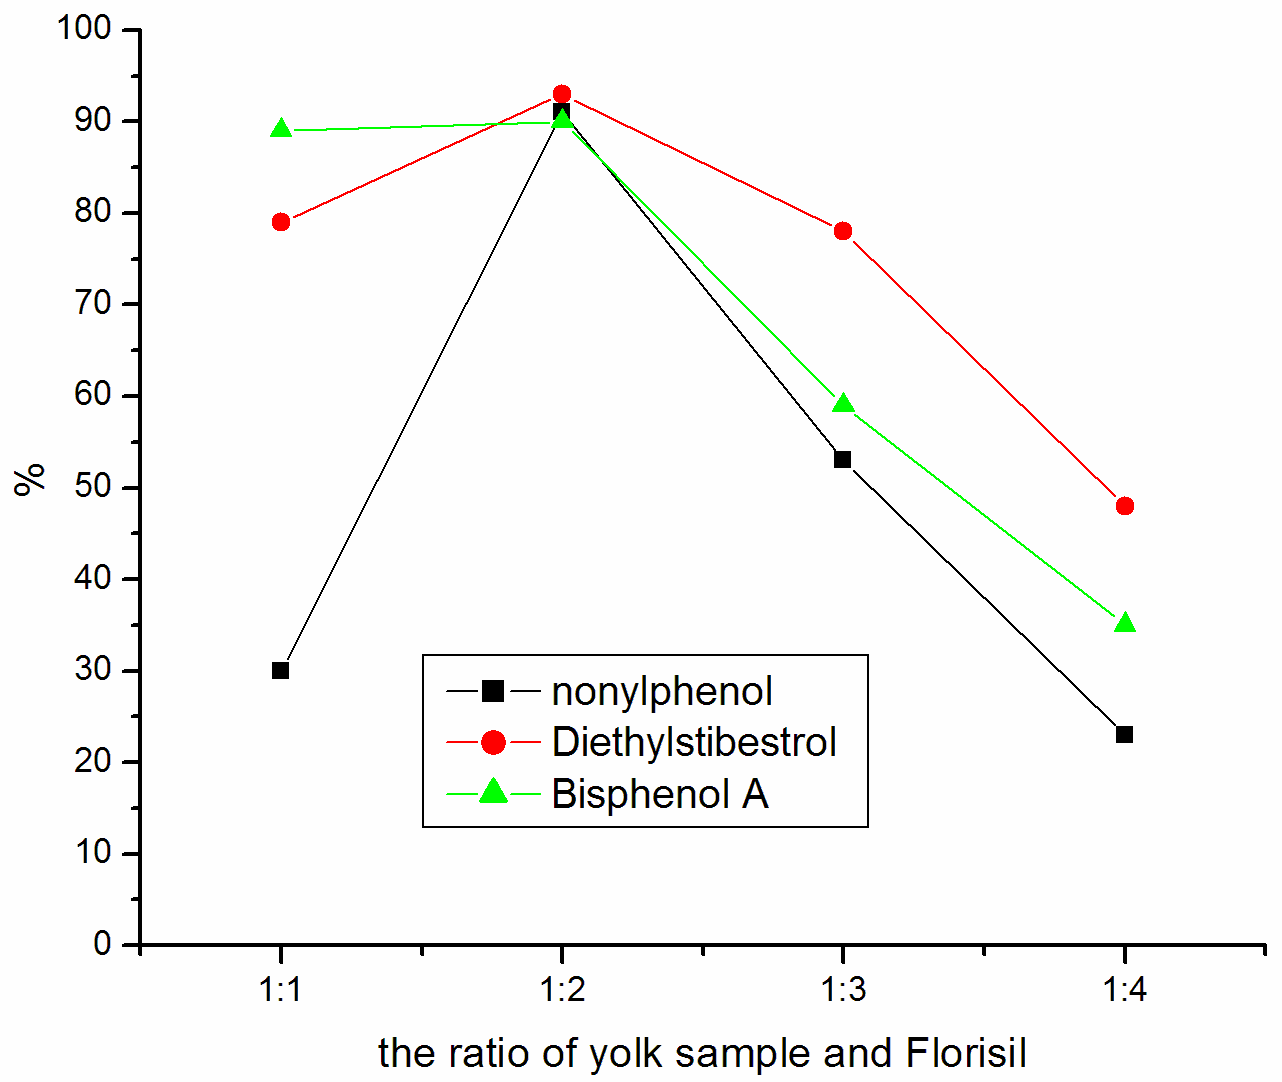
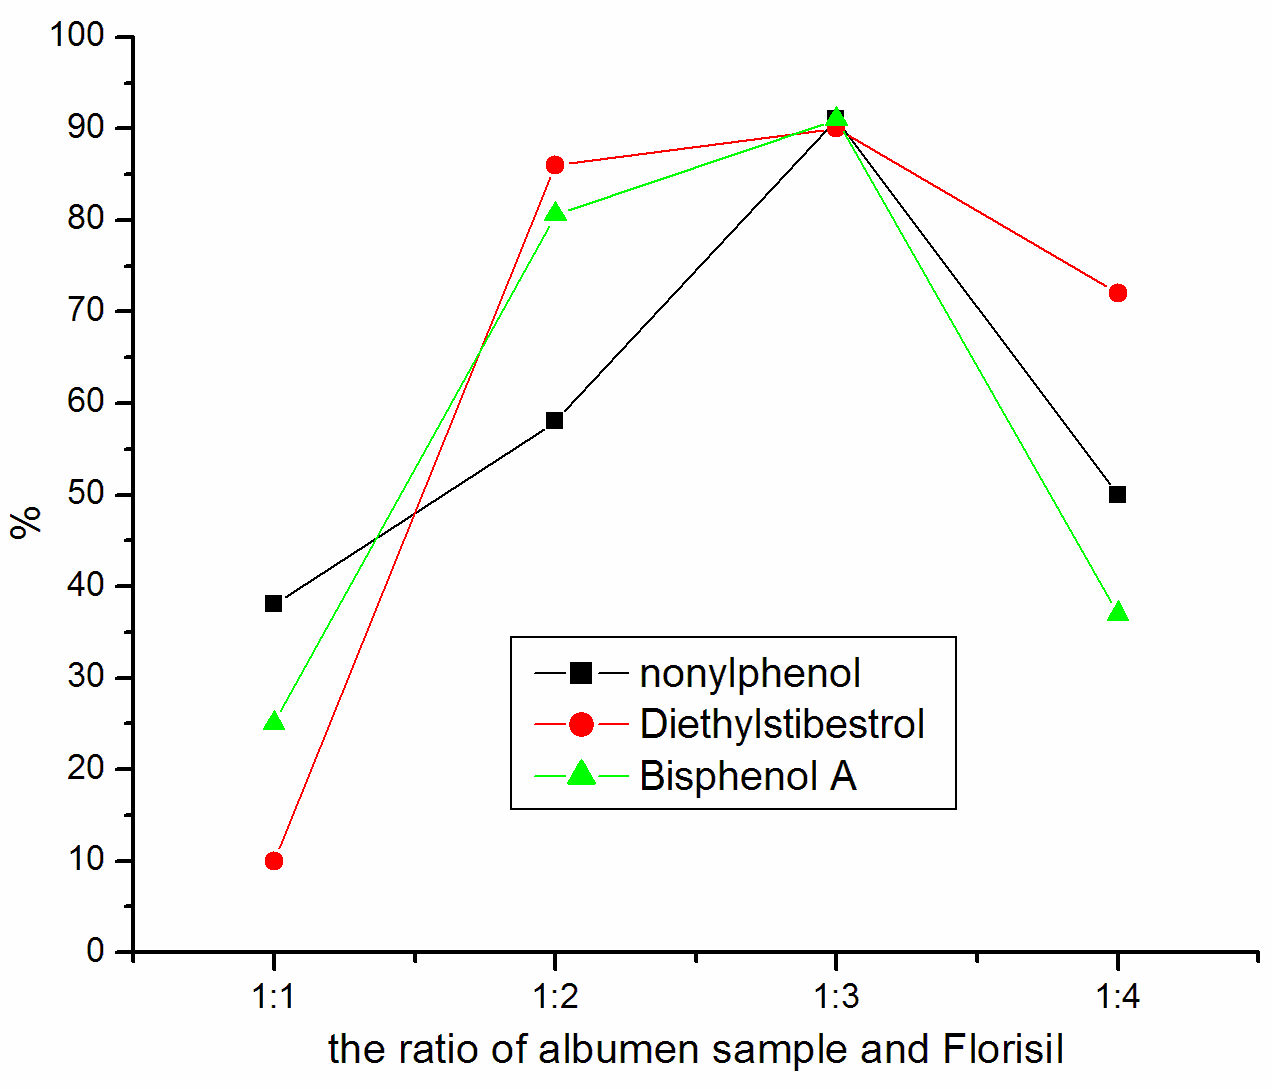
Figure 1 Influence of sample
and Florisil's proportion
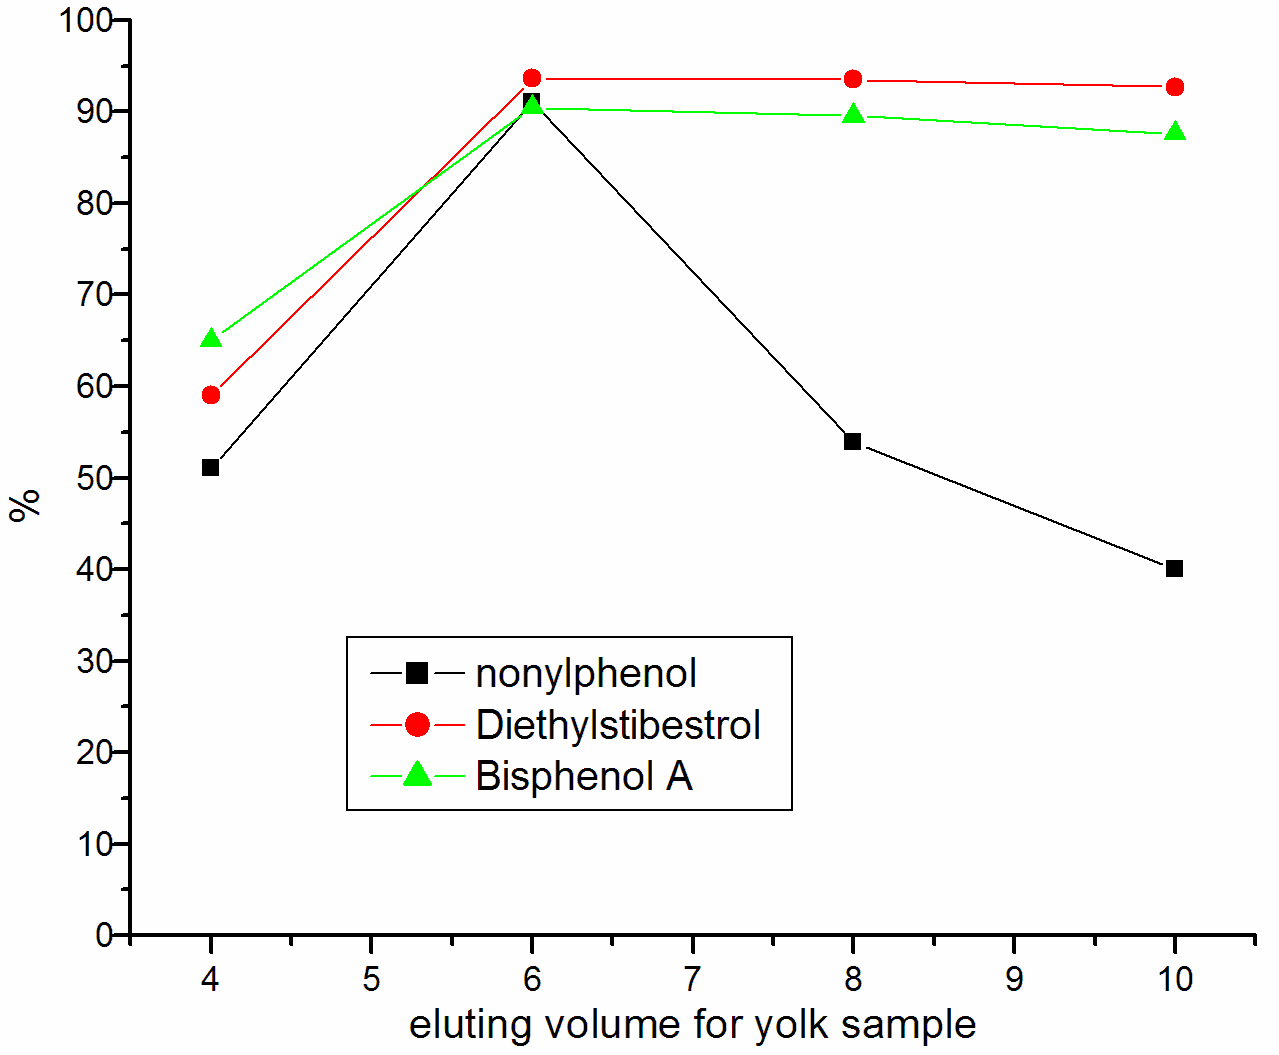
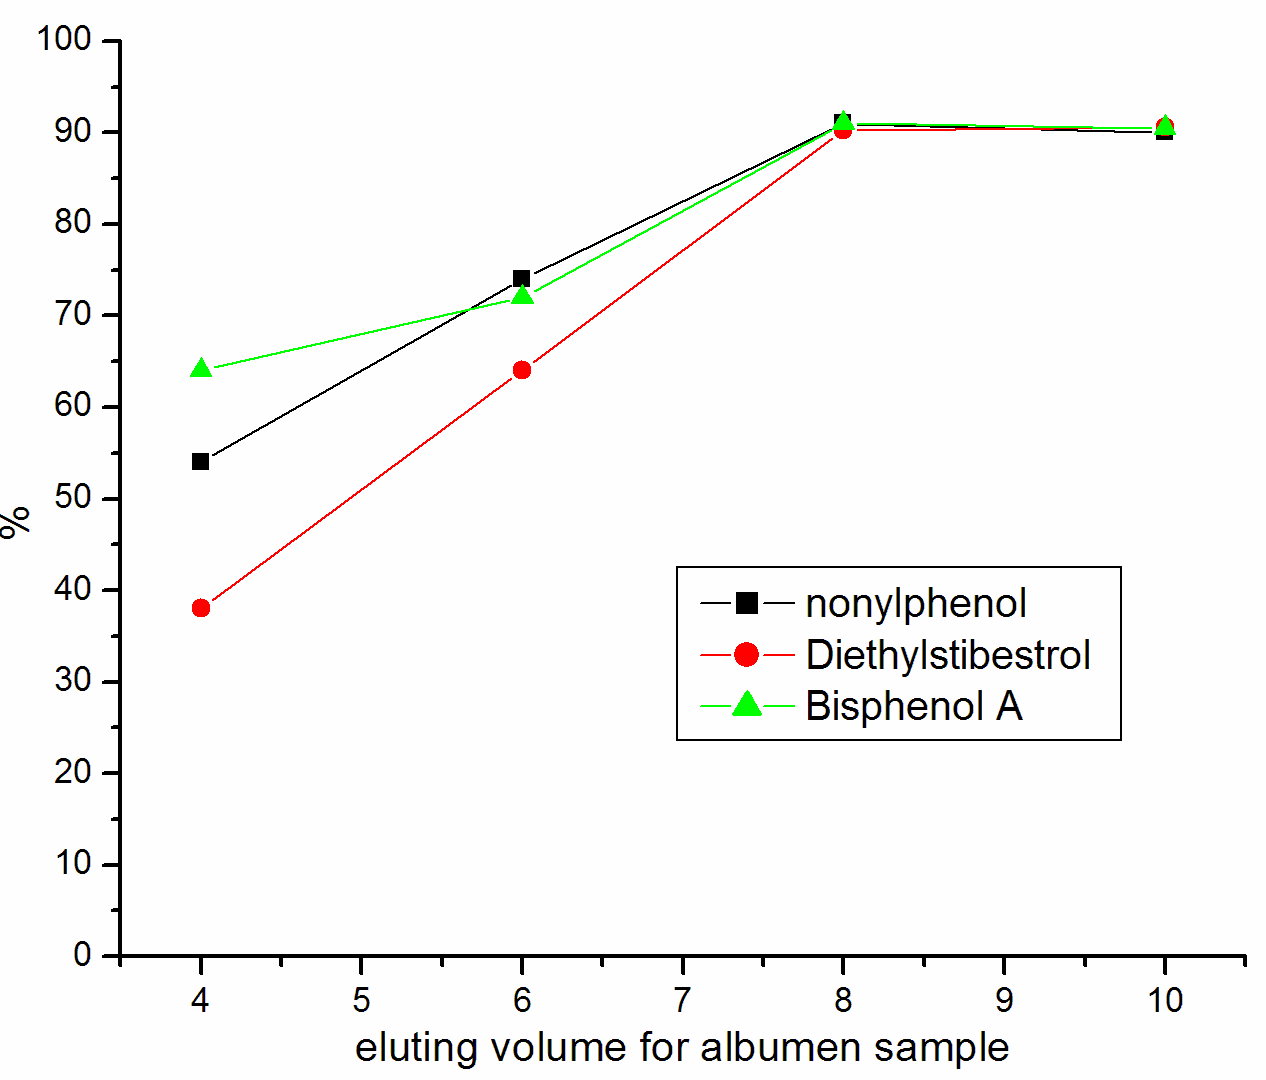
Figure 2 Influence of eluting volume
3.2 Optimization of Chromatographic
Conditions
Using Ultraviolet-visible Spectrophotometer to scan standard solution from 200-320nm. The
measurement of absorption spectra was conducted at 227 nm which gave an average maximum
absorbance for all target compounds. We have tested the single methanol and the single
acetonitrile as Mobile Phase. The peaks of BPA and DES could not be separated. Therefore,
we tested methanol-water system with different Volume ratio. The best chromatogram with
complete separation of all target compounds and interfering peaks with clear / short
retention time was obtained with the mobile phase of methanol-water (85:15, v/v). The
three phenolic environmental estrogens were detected under the optimum conditions. The
chromatograms of three phenolic environmental estrogens were shown in Figure 3. Because
nonylphenol consist of 11 isomeride, have low molar absorption coefficient, the peak was
severe stretching under the proposed chromatographic conditions.
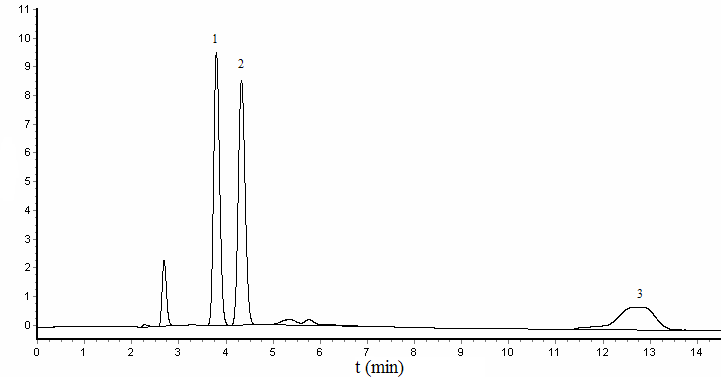
Figure 3 Chromatogram of standard substance
1- Bisphenol A, 2- Diethylstibestrol, 3- nonylphenol
3.3 Linearity and limits of detection
A series of working solutions were prepared by
diluting the mixed standard solution containing three phenolic environmental estrogens.
The working solutions were detected under the optimized chromatographic conditions. The
calibration graphs of the standard compounds were found to be linear over the
concentration range studied. Linear equations, correlation coefficients and detection
limits are listed in Table 1. On the basis of three times the noise level, the limit of
detection (LOD) was obtained.
The background interferer brought on the
result that the detection limit of yolk sample was higher than the albumen sample's in the experiment.
Table.1 Linearity and the detection limits
Components |
Detecting range ( mg/mL) |
Linear equation |
Correlation coefficient (n=5) |
Detection limit of yolk sample ( mg/g ) |
Detection limit of albumen sample ( mg/g ) |
Bisphenol A |
0.5-50 |
Y=8988.4X +1826.7 |
0.9999 |
0.032 |
0.005 |
Diethylstibestrol |
0.5-50 |
Y=9397.7X +1878.7 |
0.9998 |
0.19 |
0.05 |
nonylphenol |
0.5-50 |
Y=4616.1X +861.4 |
0.9999 |
0.06 |
0.01 |
Y-peak area; X-the concentration of the detected compound
3.4 Sample analysis and recoveries
Under the optimum experimental conditions, we determined the yolk and albumen of pickled
quail eggs, which purchased from supermarket. Positive samples had occurrence of BPA in
the albumen, the content is 0.034
Table 2 Recoveries and precision
sample |
Components |
Sample contents |
Added contents |
Determined contents |
Recoveries |
RSD |
yolk |
Bisphenol A |
n.d. |
2.0 |
1.809 |
90.45 |
2.65 |
Diethylstibestrol |
n.d. |
2.0 |
1.872 |
93.62 |
2.09 |
|
nonylphenol |
n.d. |
2.0 |
1.832 |
91.60 |
0.83 |
|
albumen |
Bisphenol A |
0.034 |
2.0 |
1.861 |
91.35 |
1.40 |
Diethylstibestrol |
n.d. |
2.0 |
1.804 |
90.20 |
1.56 |
|
nonylphenol |
n.d. |
2.0 |
1.831 |
91.55 |
1.64 |
n.d. =not detected (below the detection
limit).
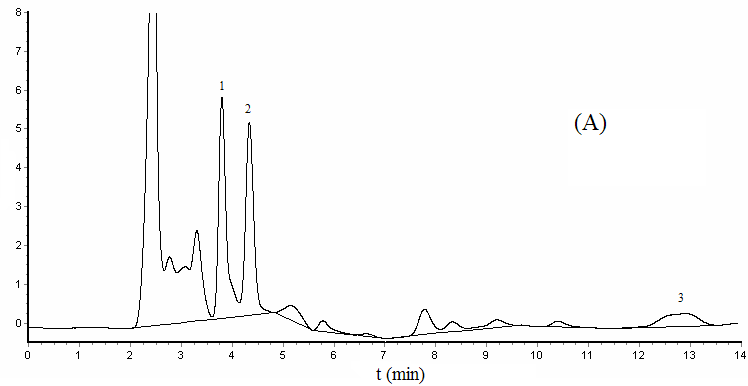
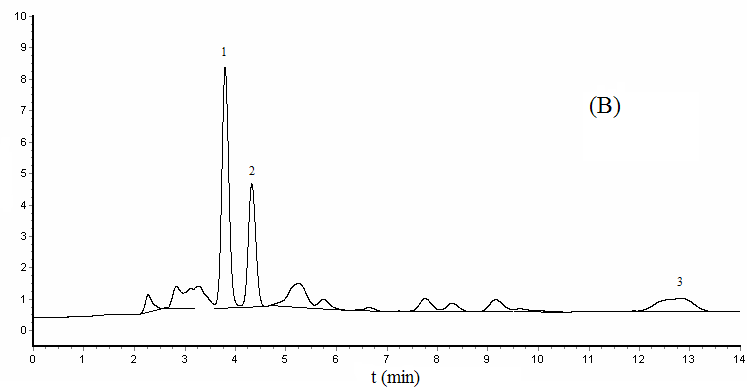
Figure 4 Chromatograms of
spiked yolk sample (A) and albumen sample (B)
1- Bisphenol A, 2- Diethylstibestrol, 3- nonylphenol
REFERENCES
[1] Liu X Y, Zhang H X, Liu M C. Journal of Instrumental Analysis (Fenxi Jiance
Xuebao), 2007,26 (2): 288~294.
[2] Liu H W, Lin L, Liu Q. Chinese Journal of Public Health (Zhongguo Gonggong Weisheng),
2006, 22 (8): 1003~1004.
[3] Liu H, Xie C N. Applied Prevent Medicine (Yingyong Yufang Yixue), 2006, 12 (6): 374~375.
[4] Barker S A, Long A R, Short C R, Journal of Chromatography A, 1989, 475 (2): 353~361.
[5] Bogialli S, Corcia A D. J. Biochem. Biophys. Methods, 2007, 70: 163~179.
[6] Pensado L, Casais M C, Mejuto M C et al. Journal of Chromatography A, 2005, 1077 : 103~109.
[7] Kunihiro K, Naoto F. Journal of
Chromatography A, 2001, 937: 39~55.
[8] Zheng P, Sheng X, Yu X F et al. Chinese Journal of
Chromatography (Se Pu), 2006, 24 (1): 62~64.
基质固相分散
-液相色谱法测定腌制鹌鹑蛋中酚类环境雌激素周建科,赵瑞峰,王立双,杨立凤
(河北大学理化分析中心, 河北省分析科学技术重点实验室 河北 保定 071002)
摘要 硅酸镁(Florisil)作固相分散剂与样品混合,二氯甲烷洗提3种酚类环境雌激素,液相色谱法测定。色谱条件为:Diamonsil C18色谱柱(5 mm,250mm ×4.6mm),甲醇-水(85:15,V/V)为流动相,紫外检测波长227nm。双酚A、己烯雌酚、壬基酚在0.5-50 mg/mL检测范围内呈良好线性关系,相关系数大于0.9998,回收率90.20%-93.62%,相对标准偏差(RSD)0.83%-2.65%。
关键词 基质固相分散;液相色谱;腌制鹌鹑蛋;酚类环境雌激素